🌍 +0.59% — the streak ended, and the wires disagree why
Friday's +0.59% ended the STOXX 600's seven-day slide — and the wires can't agree why. One credits the PMI beat, one short-covering. Both can be right.

Compiled Monday, 24 August 2026, mid-morning in Europe (about 10:15 am CEST). Index rows are final Friday closes, settled and cross-checked against two sources; currency, bond and oil rows are Monday-morning snapshots, still moving, and say so. The live paragraph beneath the table covers Monday so far.
The losing streak ended at seven. The STOXX 600 closed at 654.18 on Friday, up 0.59% — Google Finance carries the same settle — its best day since early August. What ended it is a better lesson than the streak itself, because the two most respectable accounts of Friday disagree.
📊 The Dashboard — Friday, 21 August 2026 (closes)
| Gauge | Level | Move | What this means |
|---|---|---|---|
| STOXX 600 (pan-Europe) | 654.18 | 🟢 ▲ +0.59% | Final — Investing.com historical and Google Finance agree. One green day recovered 3.83 of the 10.16 points the seven red days cost; the drawdown from 11 August is now −0.96%, not −1.54%. |
| DAX (Germany) | 26,136.56 | 🟢 ▲ +0.59% | Final — Investing.com and Google Finance agree. One day under 26,000, then straight back above it — Friday morning's flash PMI showed factory output growing fastest in four and a half years, led by Germany. |
| FTSE 100 (UK) | 10,816.56 | 🟢 ▲ +0.64% | Final — Investing.com and Google Finance agree. Friday's strongest big board and a fourth green day running — a commodity-heavy index in a week when Brent rose about 5%. |
| CAC 40 (France) | 8,484.43 | 🟢 ▲ +0.37% | Rotation row, final — Investing.com and Google Finance agree. The smallest gain of the four: Paris's luxury names steadied after Thursday's China-data fall rather than rebounding. |
| EUR/USD | ≈1.1665 | 🔴 ▼ ≈0.3% | Monday snapshot, still trading — 1.1665 from a 1.17 Friday close. A firmer dollar at the start of Jackson Hole week, not a euro story; the euro still sits near its three-month high. |
| GBP/USD | ≈1.363 | 🔴 ▼ slight | Monday snapshot, still trading — 1.3634 this morning. Sterling eases alongside the euro — the same dollar story, read through a different pair. |
| Bund 10Y yield | ≈3.25% | ⚪ ≈ flat | Monday snapshot — 3.245%, about 1 basis point lower, still near its highest since March 2011. Markets price roughly a 60% chance the ECB deposit rate reaches 3% by September 2027, and widely expect a quarter-point rise in September. |
Monday, live: as of mid-morning the STOXX 600 is down about 0.1% near 653, with the Euro STOXX 50 near 6,452 — banks supporting, technology lower, LVMH up about 2%. Brent trades near $93.30, down about 1% after last week's 5% rise, while the market waits for the US Treasury's promised Iran sanctions announcement. It reads like a market saving its energy: Nvidia reports Wednesday evening, and the Fed speaks Friday. Snapshots, not closes; Monday's final board lands tomorrow.
What happened, in plain words
Friday produced one fact and two stories. The fact: Europe's broadest index rose 0.59%, more than six of the seven daily losses that made the streak. The first story, the one the data desks told, points at Friday morning's flash PMI — activity unexpectedly improved in August, the strongest factory growth in over four years, and the market rallied on the surprise. The second story came from the flow desks: Newsquawk's close wrap found "little in terms of a clear driver" and read the move as short-covering and weekend risk management — traders who had bet on further falls buying back their positions before two days of headline risk.
Both can be true at once, and that is the lesson. A daily move gets its explanation written after the close, and the explanation is a story about millions of trades made for different reasons. When the stated cause is a data surprise, you can at least check the size of the surprise: the PMI beat expectations by 0.4 points on a 100-point scale. That is a real surprise, but a small one — small enough that positioning, the less quotable explanation, plausibly did much of the work. When two honest wraps disagree, the honest reading is: the market went up, the reasons are partly unknowable, and anyone who sounds certain is selling certainty.
⭐ Spotlight: $93 — Brent crude, the price beneath the inflation numbers
Brent crude is the price of a barrel of oil from the North Sea, and it serves as the reference price for roughly two-thirds of the world's internationally traded oil — when Europeans talk about "the oil price," this is the one they mean. It sits in this letter because it is the raw material of the inflation numbers the ECB answers to: fuel, heating, freight and plastics all reprice from it, with a lag of weeks to months. Right now it is why the Bund row above refuses to fall — Brent trades near $93.30 this morning, down about 1% today but up roughly 5% last week, on pending US sanctions against Iran, tanker traffic through the Strait of Hormuz still well below normal, and Ukrainian strikes on Russian refineries. Euro-area inflation was 2.9% in July against a 2% target; every week oil holds in the nineties makes the ECB's September decision easier to predict and Europe's borrowing costs harder to bring down.
📈 Chart of the Day — one green day against seven red
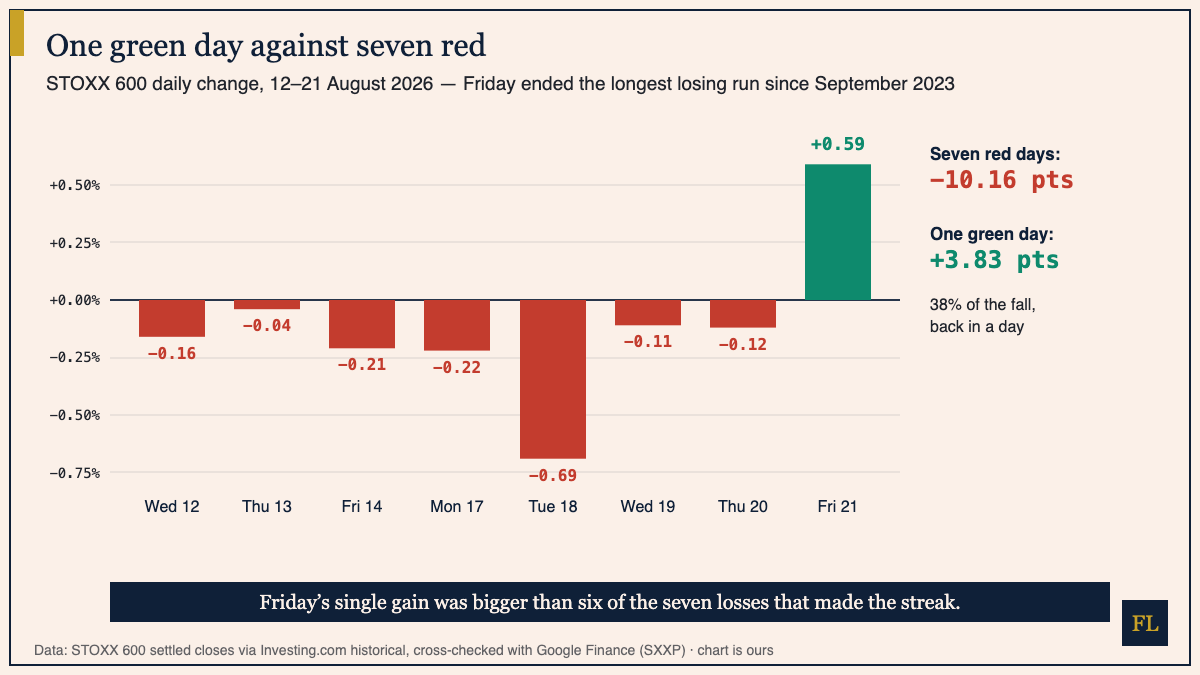
How to read this: last week we taught that a streak is a count, not a size. Here is the other half of the skill: when a streak ends, measure the ending day against the days that made it. Friday's +0.59% was larger than six of the seven losses and recovered 38% of the drawdown in one session — which tells you the selling was shallow. A streak that ends with a bar smaller than its losses is drift; one that ends with a bar this size was mostly waiting for an excuse.
📅 Tomorrow
Tuesday at 10:00 CEST Germany's Ifo business climate index lands — a survey of about 9,000 firms, and the country's most-watched sentiment gauge. It has risen three months straight to 86.6 in July; Commerzbank expects a dip to 86.0 on the Iran conflict and dearer energy. Watch whether the hard-data PMI story and the mood story agree. The rest of the week stacks up fast: Nvidia's results Wednesday evening, the ECB's July meeting account Thursday, and the Jackson Hole symposium from Thursday to Saturday, with Fed Chair Kevin Warsh's first keynote Friday morning US time — the Bund row's week ends there.
We explain; we never advise. Nothing here is investment advice.
Financial Literature is for educational and informational purposes only. Nothing here is investment, financial, legal, or tax advice, or a recommendation to buy or sell any security. Content is impersonal and not tailored to any individual. Data may contain errors — verify before relying on it. Sources: Investing.com historical (STOXX 600, DAX, FTSE 100, CAC 40); Google Finance (STOXX 600, DAX, FTSE 100, CAC 40, EUR/USD, GBP/USD); Trading Economics (Bund yield, Brent, session notes); Newsquawk close wrap (Friday); FXStreet (Commerzbank Ifo preview); Regards of Wall Street (Jackson Hole schedule).
— The Editorial Team