🌍 3.75% held by 6–3, and Britons paid 4.3% more for 1.3% less fuel
The Bank of England split the same way as in July. This morning's shop figures show why prices and quantities have to be read side by side.

Compiled Friday, 18 September 2026, at 11:34 am in Frankfurt (CEST, UTC+2), a 5-min read. Every dashboard row is Thursday's close, final. Europe's markets are open again as you read.
Yesterday's answer: B. The riyal is pegged to the dollar, so Saudi Arabia's rate is set off the Fed's, and a gap that holds at 0.625 points through every rise and cut is the mark of that link.
The Bank of England kept Bank Rate at 3.75% on Thursday by six votes to three, the same split as July, and this morning Britain's shops reported a better August than forecast.
The Bank's statement said inflation "is likely to rise further over coming quarters" and that the risks are tilted upwards, "more so than at the time of the July Monetary Policy Report". At 7 am London time the Office for National Statistics put August's retail sales volumes 0.5% above July's, where forecasts had pointed to a 0.2% fall. At the pump, Britons spent 4.3% more and bought 1.3% less fuel.
📊 The Dashboard, Thursday, 17 September 2026 (closes)
| Gauge | Level | Move | What this means |
|---|---|---|---|
| STOXX 600 (pan-Europe) | 642.60 | 🟢 ▲ +0.86% | Investing.com and Trading Economics. A second day up, as oil and gas prices eased. |
| DAX (Germany) | 25,716.71 | 🟢 ▲ +0.70% | Investing.com and Google Finance. A steady gain, a little behind the pan-European index. |
| FTSE 100 (UK) | 10,816.14 | 🟢 ▲ +1.19% | Investing.com and Trading Economics. The best of the big boards, with miners and SSE among the leaders. |
| FTSE 250 (UK mid-sized companies, rotation row) | 24,352.14 | 🟢 ▲ +1.17% | Investing.com and Google Finance. Added today: smaller companies, more of them selling inside Britain, so this row answers to UK rates and UK shoppers. |
| EUR/USD | ≈1.1476 | 🟢 ▲ +0.09% | From 1.1466. A quiet day after Wednesday's 0.7% fall on the Fed. |
| GBP/USD | 1.3356 | 🔴 ▼ −0.20% | From 1.3383. The pound slipped on the day its central bank held. |
| Bund 10Y yield | 3.48% | 🟢 ▼ −3 bp | 3.4783% from 3.5098%. Green because a lower yield means a higher price for bonds already issued. |
| Gilt 10Y yield (UK) | ≈5.24% | 🟢 ▼ lower | About 5.24%, from about 5.30%, a second day lower. |
| Brent crude | $104.82 | 🟢 ▼ −0.95% | Investing.com. Lower again on Friday morning, near $102. Europe buys crude, so green when it falls. |
What happened, in plain words
The count came in as it did in July. Six members voted to hold, and Megan Greene, Catherine Mann and Huw Pill voted to raise to 4%; the three said in the minutes that inflation would peak in early 2027, "just as wage settlements were agreed". The Bank also voted unanimously to run its stock of bonds bought in the quantitative easing years down to zero by the end of 2034, with £20 billion of sales a year alongside bonds as they mature. European shares rose close to 1% as oil and gas prices eased, Britain's ten-year borrowing cost fell for a second day, and the pound slipped. The Bank said activity had been "slightly stronger than expected", and this morning's shop figures were one more piece of that.
⭐ Spotlight: UK retail sales volumes, +0.5%
Today's rotating row is Britain's monthly Retail Sales Index, and the figure reported is volume: the quantity of goods bought, with price changes taken out. The Office for National Statistics builds it from a monthly survey of retailers (in August, forms covering 92.3% of the sample's turnover came back), then adjusts for the season. Anyone tracking British households watches it, because shops are the first hard figure on spending each month. The ONS itself says a single month is volatile and should be read with the three-month change: volumes rose 0.9% in the three months to August, and August stood at its second-highest level since April 2022. It also publishes value, the money spent, and that is where today's chart begins.
📈 Chart of the Day: spent more, bought less
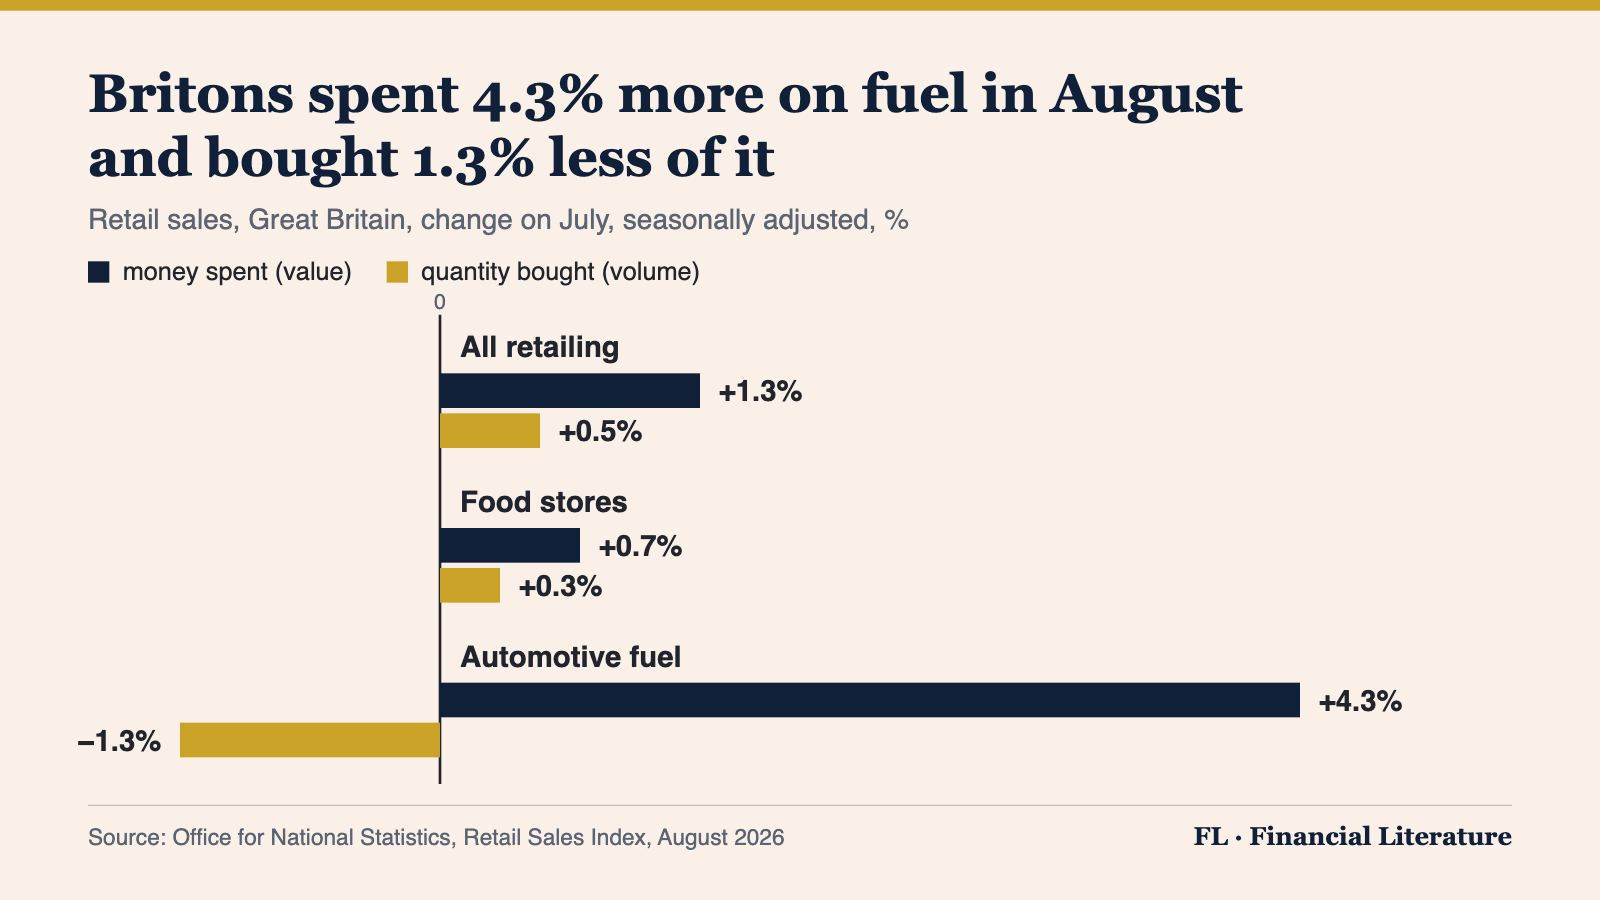
How to read this. Value is the money that went through the till; volume is the same spending with price changes taken out, the quantity that left the shop. When the two bars sit apart, the gap between them is prices. For food stores in August it was small. When value rises and volume falls, as at the pump in August, the price rose faster than spending did: the ONS's own implied fuel price, before seasonal adjustment, rose 6.5% on the month. Retailers told the ONS some motorists were only partly filling their tanks. So when a headline says spending rose, check which bar it means. Wednesday's issue read the same petrol in the inflation figures.
📅 Tomorrow
The next issue lands Monday and reads Friday's close. The Bank of England's next decision is due on 5 November. Its record of Bank Rate, back to 1694, and the daily gilt yields are free to pull: Bank of England Database on the Data Catalog.
One question. Today's chart showed fuel spending up 4.3% and fuel volumes down 1.3% in August. Which reading is right? A: Motorists bought more fuel, because they spent more on it. B: The price per litre rose by more than spending did, so people paid more and took home less. C: The two figures contradict each other, so one of them must be wrong.
Financial Literature is for educational and informational purposes only. Nothing here is investment, financial, legal, or tax advice, or a recommendation to buy or sell any security. Content is impersonal and not tailored to any individual. Data may contain errors, verify before relying on it. We explain; we never advise. Sources: Bank of England, UK Office for National Statistics, Global Banking & Finance Review, Investing.com, Google Finance, Trading Economics.
Forwarded this by a friend? Subscribe here. Found it useful? Forward it to one person who'd want it.
— The Editorial Team