What is the difference between retail sales value and volume?
Value is money through the till; volume is what it bought once prices are taken out. In August, Britons spent more on fuel and bought less of it.

The short answer: Value is the money that went through shop tills; volume is the same spending with price changes taken out, which makes it a measure of the quantity of goods bought. When prices move fast the two can split, and in August Britons spent 4.3% more on fuel than in July while buying 1.3% less of it.
That split was the chart in Friday's issue, and the same petrol had already shown up on Wednesday, lifting Britain's inflation rate to 3.1%. What follows is the part of both stories that does not change from month to month.
What the two numbers are
Britain's Office for National Statistics builds its Retail Sales Index from a monthly survey of about 5,000 retailers, drawn from a population of roughly 200,000. Each one reports its turnover, the money taken including VAT, and that becomes the value index. The volume index is made from it. In the ONS's words: "Value estimates of retail sales reflect both price and volume changes. To remove the direct effects of price changes, value data are deflated to produce RSI volume measures." The deflator for each kind of shop is a basket of price indices from the consumer price statistics, so a petrol station's takings are divided by petrol prices and a supermarket's by food and household-goods prices.
Who quotes which
The ONS leads with volume. Its August bulletin opens on "the quantity of goods bought (volume)", and the 0.5% monthly rise in volume was the figure in the headlines. The euro area goes further and headlines volume alone. Eurostat's index, by its own definition, "measures the evolution of the turnover in retail trade, adjusted for price changes (deflated), i.e. the evolution of the total amount of goods sold", and it fell 0.6% across the euro area in July. The monthly series for every member state is free to pull: Eurostat on the Data Catalog. Volume matters beyond the shops, too: the ONS uses retail sales as a source for household spending in its estimates of GDP.
How to read a move
Put the two numbers side by side and read the gap as price. Divide one change by the other and what is left is roughly what happened to prices: for fuel in August, 1.043 divided by 0.987 is about 1.057, a rise of nearly 6% in the price per litre in one month on the adjusted figures. The ONS's own implied fuel price, before seasonal adjustment, rose 6.5%. At food stores, where value rose 0.7% and volume 0.3%, the gap and so the price change were far smaller.
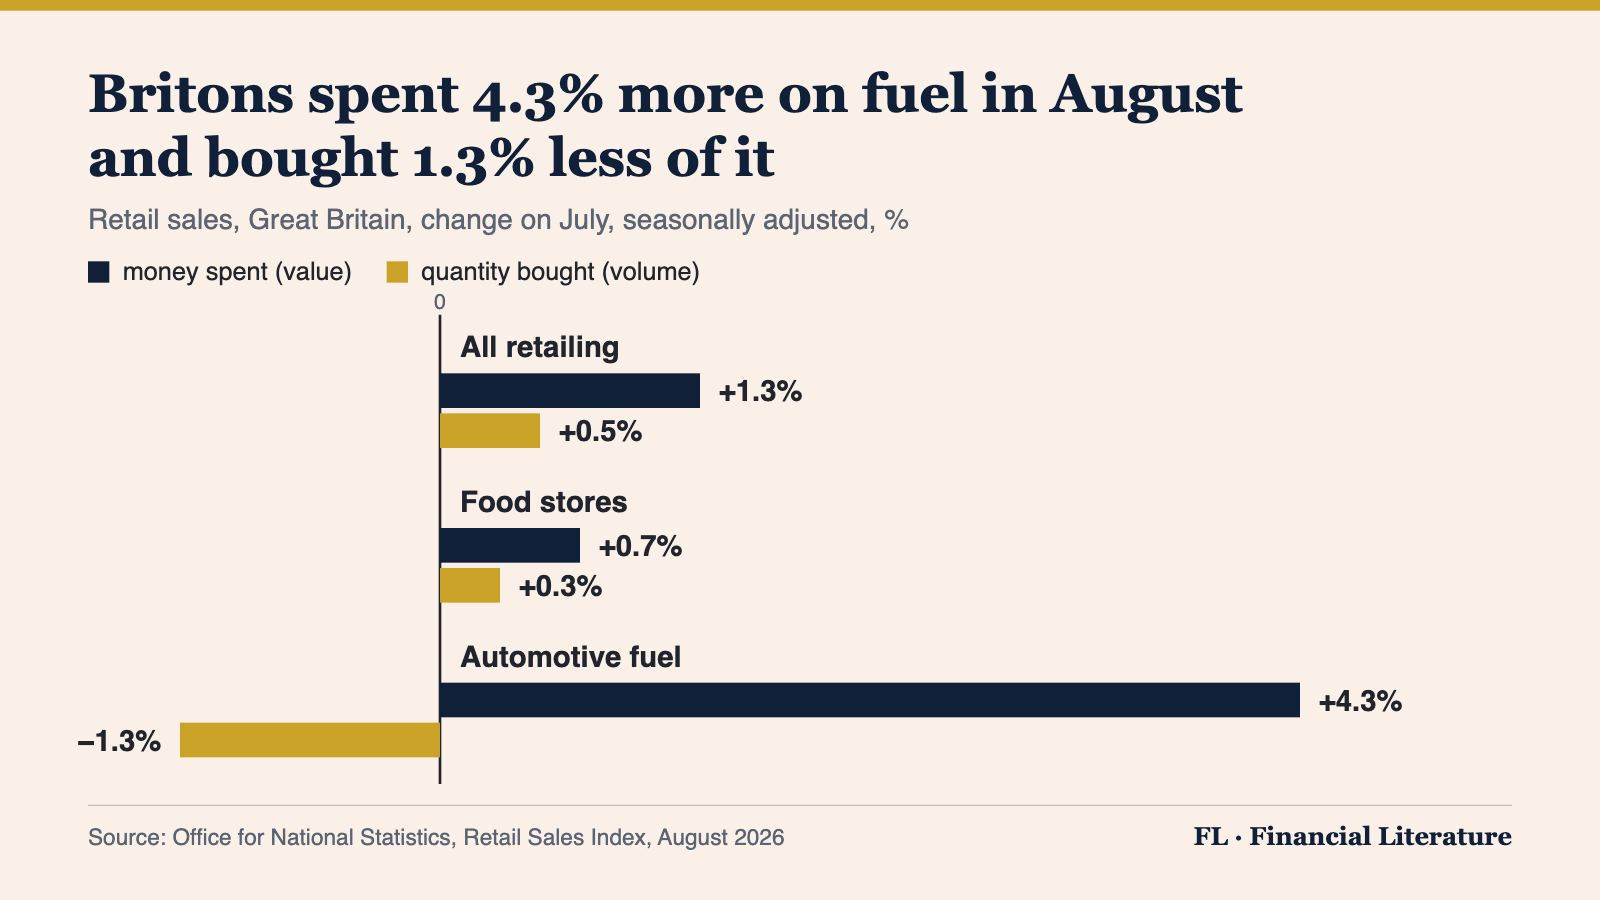
How to read this: each pair of bars is one kind of shop, navy for money spent and gold for quantity bought. When the gold bar is shorter than the navy one, prices rose over the month. When the two point in opposite directions, as they do for fuel, prices rose by more than spending did, and households paid more for less. So a headline that says spending rose needs one more question before it means anything: in pounds, or in litres?
What this is not
Volume is not a count of items or of shoppers. It is spending re-priced at a fixed year's prices, so a switch from cheaper goods to dearer ones can raise volume even when the number of things bought stays the same. It is not all of consumer spending either: the index covers goods sold by retailers operating in Great Britain, and the ONS notes it "does not include Northern Ireland", while restaurants, travel and rent sit outside it altogether. And a rise in value is not good news by itself. August's fuel line is a rise in value made entirely of price.
The habit
Whenever a spending figure moves, ask whether it is money or quantity, then find the other one. We read the pair at the pump on Friday and the same petrol through the inflation figures on Wednesday. Last Saturday's explainer covered the other adjustment in these tables, what seasonally adjusted means. The archive keeps the daily series.
Financial Literature is for educational and informational purposes only. Nothing here is investment, financial, legal, or tax advice, or a recommendation to buy or sell any security. Content is impersonal and not tailored to any individual. Data may contain errors, so verify before relying on it. We explain; we never advise. Sources: UK Office for National Statistics, Eurostat, Reuters via Global Banking & Finance Review.
Forwarded this by a friend? Subscribe here. Found it useful? Forward it to one person who'd want it.
— The Editorial Team