What does “seasonally adjusted” mean, and why can one month fall and rise at once?
German motorway freight fell sharply from July to August and rose at the same time. Both are true. A plain-words guide to adjusted economic numbers.

The short answer: a seasonally adjusted number has had the part of the change that happens every year at that time of year taken out of it, so what is left can be compared with the month before. The raw number and the adjusted number are both correct, and they answer different questions.
Wednesday gave a clean example. Measured as the lorries actually drove, German motorway freight fell about 11.8% from July to August. Adjusted, the same month rose 0.6%, and stood 2.0% above August last year. Nobody changed the data in between.
What the adjustment does
Eurostat defines it in one sentence. Seasonal adjustment is "a statistical method for removing the effects of recurring seasonal influences which have been observed in the past from an economic time series, thus showing non-seasonal trends more clearly". The key word is recurring. Germany empties its factories and offices in August every year, and it did so last year and the year before, so the August drop carries almost no news. The adjustment asks a better question: was this August busier or quieter than a normal August?
A second adjustment usually rides alongside it. Calendar adjustment removes the calendar effect, which is the accident of how the days fell: a month with more working days than usual, a leap year, 1 May landing on a Sunday, Easter moving between March and April. Those things change the number without changing the economy. When a release says "calendar and seasonally adjusted", as the German freight figures do, both have been taken out.
Who does it, and how
Statistical offices and central banks do it, mostly with the same family of software. The US Census Bureau's X-13ARIMA-SEATS is the standard tool across Europe as well, and the bureau describes the job plainly: "seasonal adjustment is the estimation and removal of seasonal effects from a time series to reveal certain nonseasonal features". Estimation is the operative word. The seasonal pattern is not known in advance; it is measured from years of past data, then applied.
The German freight index shows how institutional this is. The toll records come from the Federal Logistics and Mobility Office, the statistical office publishes the index because it "provides approximate indications of the development of industrial production in Germany at an early stage", and the daily version of the adjustment is carried out by the Bundesbank, which still labels it experimental because the methods for adjusting daily data are under development.
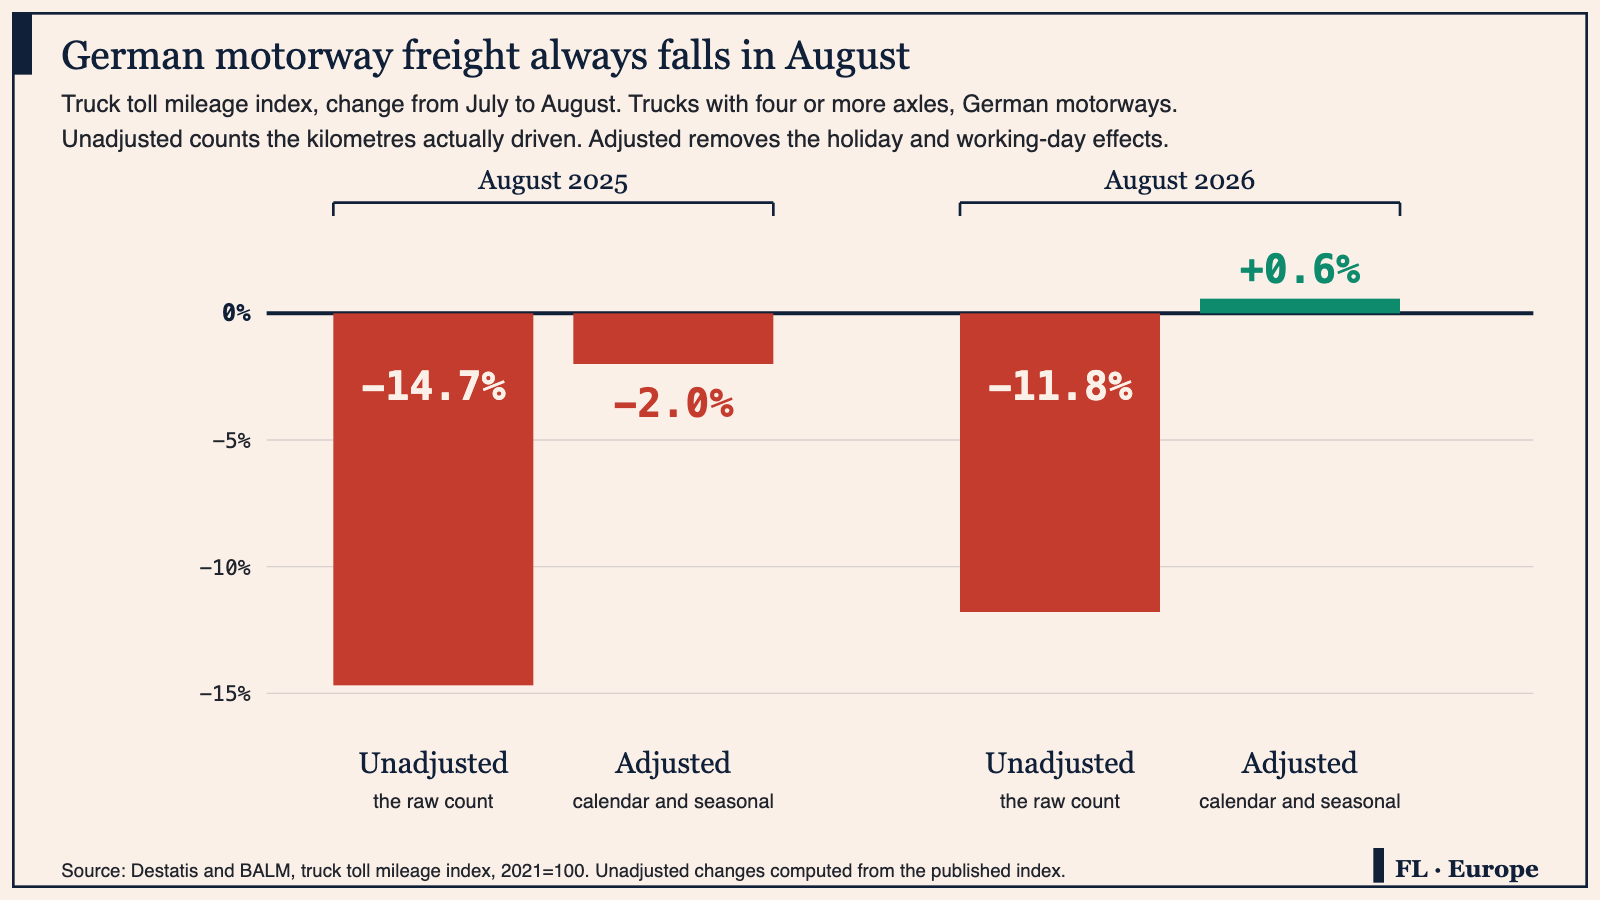
How to read this: a raw number and an adjusted number answer different questions, so they can point in opposite directions in the same month without either being wrong. Raw, the index counts the kilometres actually driven, and it falls every August because a good part of Germany is on holiday and there are fewer working days. Adjustment strips out the pattern that repeats every year, so the question becomes whether this August was busier or quieter than a normal August, which is the only version you can honestly set beside July. When you meet a monthly figure, look for the words "seasonally adjusted" before you decide what it told you.
How to read a move
Three habits cover most cases. First, find out which series you are holding, because most month-on-month figures in Europe are adjusted and most year-on-year figures are not, or are calendar-adjusted only. Comparing an adjusted monthly change with an unadjusted annual one is the commonest way to get a release backwards.
Second, remember that a year-on-year comparison needs no seasonal adjustment at all, because it already compares August with August. That is why offices publish it next to the adjusted monthly change: the two together tell you the direction and the pace.
Third, when the two disagree loudly, look for the physical reason. In Monday's German production figures it was a multi-week car plant shutdown, an event no adjustment is meant to smooth away.
What it is not
It is not a correction, and neither version is the real one. It is not a forecast; every adjusted figure describes a month that has already happened. It does not remove one-off shocks, because the Census Bureau's own list of what stays in the series includes "unseasonable weather, natural disasters, strikes". And it is not final. Adjusted figures are revised as fresh months arrive, since each new observation improves the estimate of the seasonal pattern, which is why a month can be restated without anyone having made a mistake.
The habit
Read the label before the number. We did that on Wednesday, when German freight fell and rose in the same breath, and the same instinct runs through the archive, where every dashboard row says what it is and when it was true.
Financial Literature is for educational and informational purposes only. Nothing here is investment, financial, legal, or tax advice, or a recommendation to buy or sell any security. Content is impersonal and not tailored to any individual. Data may contain errors, so verify before relying on it. We explain; we never advise. Sources: Eurostat, Federal Statistical Office of Germany, Federal Logistics and Mobility Office, US Census Bureau.
Forwarded this by a friend? Subscribe here. Found it useful? Forward it to one person who'd want it.
— The Editorial Team