🌍 Seven red days in a row — and the index barely moved
The STOXX 600 fell for a seventh straight session, its longest run since 2023 — and lost about 1.5% doing it. Why a streak and a slide differ.

Compiled Friday, 21 August 2026, mid-morning in Europe (about 10:30 am CEST). Index rows are final Thursday closes, settled and cross-checked against two sources; currency, bond and oil rows are Friday-morning snapshots, still moving, and say so. The live paragraph beneath the table covers Friday so far, including this morning's flash PMIs.
The STOXX 600 closed at 650.35 on Thursday, down 0.12% — Google Finance carries the same settle — which makes seven declines in a row, the longest daily losing streak since September 2023. Seven sounds like a lot. The seven days together cost 1.54%. Today's lesson is the difference between those two numbers.
📊 The Dashboard — Thursday, 20 August 2026 (closes)
| Gauge | Level | Move | What this means |
|---|---|---|---|
| STOXX 600 (pan-Europe) | 650.35 | 🔴 ▼ −0.12% | Final. Seventh straight decline; from 660.51 on 11 August to here is −1.54%. Luxury did Thursday's damage — LVMH and Adidas about 3% lower, Hermès 2% — after China's weak July retail sales; Airbus, Safran and Rheinmetall lost around 2%. |
| DAX (Germany) | 25,983.04 | 🔴 ▼ −0.42% | Final — Investing.com and Google Finance agree. First close under 26,000 this week; the wire's −0.42% matches the settle, unlike Tuesday when the morning number lagged the close. |
| FTSE 100 (UK) | 10,748.16 | 🟢 ▲ +0.04% | Final — Investing.com and Google Finance agree. Three small green days in a row while the continent fell: a commodity-heavy index in a week when Brent rose about 5%. |
| CAC 40 (France) | 8,453.09 | 🔴 ▼ −0.57% | Rotation row, final — Investing.com and the closing wire agree. Thursday's weakest big board for the second time this week; Paris holds the luxury names that fell on the China data. |
| EUR/USD | ≈1.170 | ⚪ ≈ flat | Friday snapshot, still trading — 1.1695 against a 1.17 previous close. The euro held Wednesday's three-month high after the PMIs; a strong print and a flat currency means the market had already priced a firmer ECB. |
| GBP/USD | ≈1.364 | 🟢 ▲ ≈0.3% | Friday snapshot, still trading — 1.364 from a 1.36 previous close. Sterling's third firmer day running, still the weaker-dollar story rather than a UK one. |
| Bund 10Y yield | ≈3.25% | ⚪ ≈ flat | Friday snapshot. Holding near 3.25%, a whisker under this week's 2011 highs; markets now price the ECB deposit rate at about 2.76% by next March. The Fed's July minutes, out Wednesday evening, said officials were "prepared to raise interest rates further" — the reason Washington's bond buybacks did not hold yields down for long. |
Friday, live: as of mid-morning the STOXX 600 is up about 0.3% near 652, on course to end the streak at seven: basic resources lead on firmer gold, ASML and Santander are up more than 1%. The August flash PMIs landed at 10:00 CEST — see the Spotlight. Brent trades near $93.45, a touch lower on the day but about 5% higher on the week, with new US sanctions on Iran and Ukrainian strikes on Russian refineries behind the rise. Snapshots, not closes; Friday's final board lands Monday.
What happened, in plain words
A losing streak is a count of days, and it says nothing about size. The STOXX 600's seven red days were, in order, −0.16%, −0.04%, −0.21%, −0.22%, −0.69%, −0.11% and −0.12% — six of the seven smaller than a quarter of a percent, and only Tuesday's, when bond yields jumped, the size of a normal bad day. Added up they took the index from 660.51 to 650.35, a fall of 1.54%. For scale, Seoul's KOSPI lost 5.80% on Wednesday alone and got most of it back on Thursday. Europe's market has not been sold; it has been drifting lower by small amounts on thin August volume while two bigger forces argue overhead — bond yields at 2011 highs pulling one way, and a Treasury buying back its own long bonds pulling the other.
The streak still earned its headline, and it is worth knowing why. Streaks travel well because they are simple, and because each extra day adds to the count without needing a big move. The number to read alongside any streak is the drawdown — how far the index sits below its recent high — because that is what a portfolio actually feels. Seven days and 1.5% is a pause. Seven days and 15% is a rout. Same headline word.
⭐ Spotlight: 52.1 — the flash PMI, and the line at 50
This morning's HCOB flash eurozone composite PMI came in at 52.1 for August, from 52.0 in July — a nine-month high, above the 51.7 forecasters expected. A Purchasing Managers' Index is a survey, not a tally of output: several thousand companies are asked each month whether things like new orders, output and hiring are better, the same or worse than last month. The answers are scored so that 50 means no change — above 50, more firms report improvement than deterioration; below 50, the reverse. That is why PMIs move markets days or weeks before official statistics: they are the earliest reading of the month. Today's detail is the manufacturing side — 52.8, up from 51.9, with factory output growing at its fastest pace in four and a half years, led by Germany — while services held at 51.7 and business confidence weakened. Read it as a direction, not a speed: 52.1 says "modestly more firms improving than worsening," and the distance above 50 is the whole message.
📈 Chart of the Day — seven red days, one small number
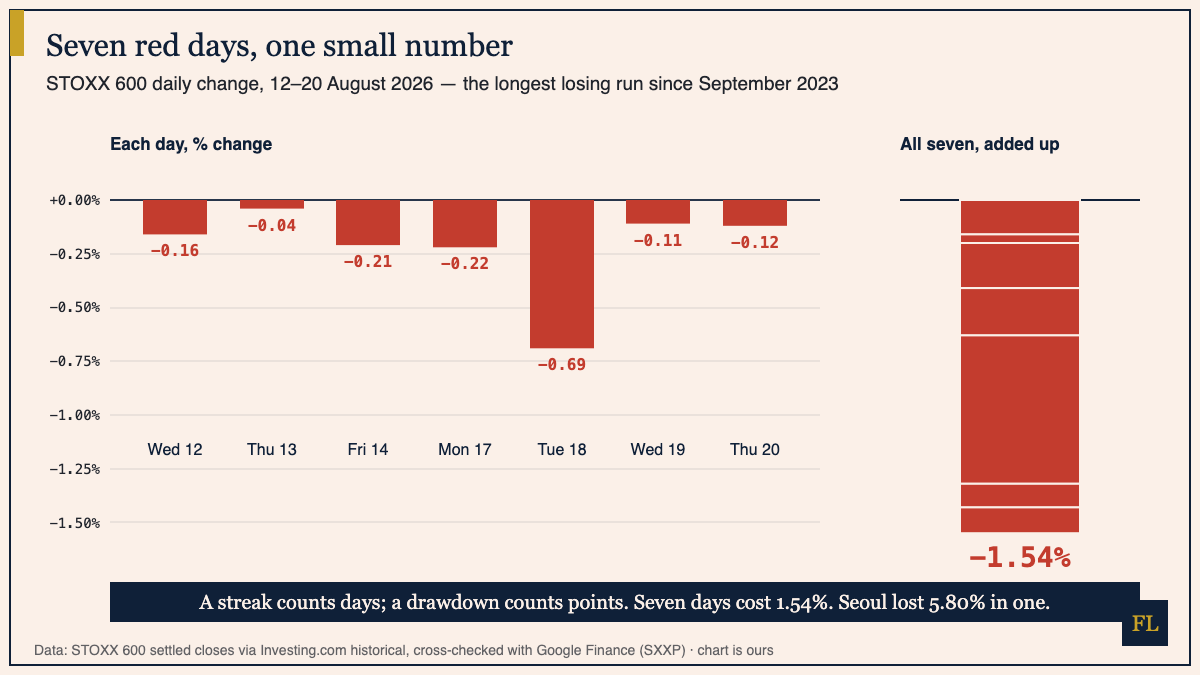
How to read this: the left panel shows each day's change on its own; the right panel stacks the same seven bars into one. A streak headline describes the left panel's colour; a drawdown describes the right panel's height. When you see "longest losing run since…", find the start date, look up the level that day, and divide — the answer is usually smaller than the headline feels. The same skill works in reverse: Seoul's KOSPI rose 20% from its July low in eleven days, and that streak was mostly size.
📅 Next week
Gulf markets reopen on Sunday; Europe's final board for this week lands in Monday's issue. The week's event is the Federal Reserve's Jackson Hole symposium, which opens on Thursday 27 August — this week's Fed minutes set the tone, and the Bund row above will take its cue from whatever is said about "further" rate rises. On the data side, the flash PMIs become final in the first days of September, and the eurozone's August inflation estimate arrives around then too.
We explain; we never advise. Nothing here is investment advice.
Financial Literature is for educational and informational purposes only. Nothing here is investment, financial, legal, or tax advice, or a recommendation to buy or sell any security. Content is impersonal and not tailored to any individual. Data may contain errors — verify before relying on it. Sources: Investing.com historical (STOXX 600, DAX, FTSE 100, CAC 40); Google Finance (STOXX 600, DAX, FTSE 100, EUR/USD, GBP/USD); Trading Economics (Euro STOXX 50 and session notes, Bund yield, Brent, composite PMI); FX.co (HCOB manufacturing PMI); Investing.com news (seventh-session streak, Fed minutes); The Peninsula/closing wire (Thursday closes).
— The Editorial Team