🌍 The 60-day deal expired — oil didn't blink
The US–Iran memorandum lapsed with Hormuz still shut, and Brent barely moved. What a non-reaction tells you, plus the week UK inflation takes the stage.

Compiled Monday, 17 August 2026, mid-afternoon in Europe (about 2:30 pm CEST). Index rows are final Friday closes, settled and cross-checked; currency, bond, and oil rows are Monday-afternoon snapshots, still moving, and say so. The live paragraph beneath the table covers Monday so far.
The 60-day US–Iran memorandum expired today with no new talks scheduled and the Strait of Hormuz still closed — and Brent crude, at about $89, barely moved. That non-reaction is the day's whole lesson.
📊 The Dashboard — Friday, 14 August 2026 (closes)
| Gauge | Level | Move | What this means |
|---|---|---|---|
| STOXX 600 (pan-Europe) | 657.86 | 🔴 ▼ −0.21% | Final. The quiet Friday fade snapped a four-week winning streak — the first weekly loss in five, of about a third of a percent, still within 1% of the record. |
| DAX (Germany) | 26,440.31 | 🟢 ▲ +0.53% | Final. The only major board to rise Friday and the only one to finish the week higher — Frankfurt keeps setting the pace, holding near record ground. |
| FTSE 100 (UK) | 10,750.11 | 🔴 ▼ −0.21% | Final. A fifth consecutive losing session, with miners and pharmaceutical stocks doing the dragging — today's chart shows what that streak cost the week. |
| CAC 40 (France) | 8,636.80 | 🔴 ▼ −0.16% | Rotation row, final. A small step back. (Two of our sources print Paris's close two points apart — 8,636.80 vs 8,635 — a reminder that even "final" numbers carry last-tick wobble.) |
| EUR/USD | ≈1.159 | 🟢 ▲ ≈0.2% | Monday snapshot, still trading. The euro firmed as markets price roughly an 84% chance of a September ECB rate rise while bets on a Fed hike keep fading — currencies trade the gap between two central banks, not one. |
| GBP/USD | ≈1.356 | 🟢 ▲ ≈0.2% | Monday snapshot, still trading. The pound touched its highest in more than three months — positioning ahead of a heavy UK data week, not a reaction to any Monday number. |
| Bund 10Y yield | ≈3.20% | ⚪ ≈ flat | Monday snapshot. Germany's benchmark borrowing rate holds near its highest in more than 15 years — the oil-inflation-yields chain from last week, still taut. |
Monday, live: as of mid-afternoon the STOXX 600 was up about 0.2% near 659, the DAX flat around 26,450, and the FTSE 100 hovering just above Friday's close — on course, if it holds, to end its losing streak. The lift came from the mining row: basic resources rose 1.4%, with Antofagasta, Hochschild Mining and Glencore up roughly 2.2% to 2.7%, as a softer dollar and fading Fed-hike bets lifted metals — gold traded near $4,391, up 0.4%. Elsewhere Rolls-Royce gained 1.8% after two banks raised their price targets. Snapshots, not closes; Monday's final board lands in tomorrow's issue.
What happened, in plain words
The deadline everyone had circled arrived and produced nothing. The 60-day memorandum signed in Islamabad in June lapsed today with the stalemate intact: the Strait of Hormuz — which before the war carried about a fifth of the world's oil and gas — stays closed to normal shipping, and Iran's foreign minister says no decision has been made to restart negotiations, while Tehran works with Oman on alternative shipping arrangements. The traffic data got worse, not better: five vessels transited the strait on Saturday and none on Sunday, against 31 the previous weekend.
And yet Brent sat near $89, roughly where it ended last week. Here is the reading skill: prices react to surprises, not to situations. A closed strait is terrible news, but it is six-week-old terrible news — last week's 4% oil rally already carried it. When the worst-case headline finally prints and the price shrugs, the market is telling you the bad news was already in the price — and that traders are watching the offsets, from Oman workarounds to barrels quietly moving through anyway. For Europe, the strait lives on in the dashboard regardless: it is why the Bund yield row sits at a 15-year high and why Wednesday's UK inflation number is the week's main event.
📈 Chart of the Day — one week, four Europes
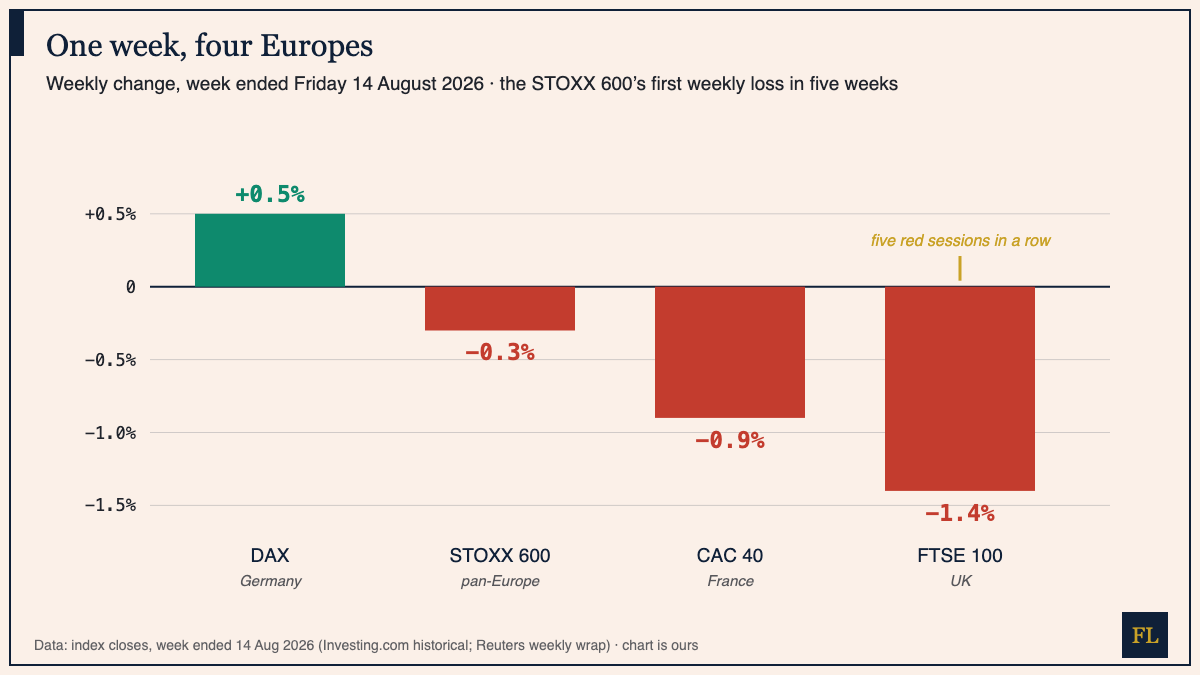
How to read this: "European shares fell this week" is true and nearly useless — the gap between the DAX's gain and the FTSE's 1.4% loss is wider than the headline move itself. The reason is composition: London's index leans on miners, energy and pharmaceuticals, so a wobbly commodity week hits it hardest, while Frankfurt's exporters and industrials kept climbing. Habit to build: when you read that "Europe" or "the market" did something, ask which index — and what it is made of — before you believe the verb. One number's weekly loss is another's record week; both are Europe.
📅 The week ahead
Tomorrow brings the UK jobs report and Germany's ZEW investor survey. Wednesday is the main event: UK July inflation, which forecasters see rising toward 4% from June's 3.6% — watch the pound's three-month high for its verdict — alongside minutes from the Fed's last meeting. Late in the week come the flash PMIs (our sources disagree on the exact day) and, from Friday, the Fed's Jackson Hole gathering, 21–23 August — the annual stage for central-bank signal-sending.
We explain; we never advise. Nothing here is investment advice.
Financial Literature is for educational and informational purposes only. Nothing here is investment, financial, legal, or tax advice, or a recommendation to buy or sell any security. Content is impersonal and not tailored to any individual. Data may contain errors — verify before relying on it. Sources: Investing.com historical (STOXX 600, DAX, FTSE 100, CAC 40); Reuters weekly wrap; Trading Economics (FTSE, EUR, GBP, Bund, Brent/Hormuz shipping); Reuters via ts2 (Monday session); The National (memorandum expiry); Al Jazeera (Iran talks); Newsquawk and FXStreet (week ahead).
— The Editorial Team