🌍 UK +0.4% — one report card, two true stories
Britain's economy grew 0.4% last quarter — a slowdown hiding a June rebound. How one GDP report tells two true stories, and oil's six-day run ends.


Compiled Thursday, 13 August 2026, mid-morning in Europe (about 10:30 CEST). Index rows are final Wednesday closes; the currency and bond rows are Thursday-morning snapshots, still moving, and say so. The live paragraph beneath the table covers Thursday so far.
Britain's growth report card arrived this morning: the economy expanded 0.4% in the second quarter — exactly what forecasters expected, slower than the start of the year, and hiding a June surprise worth a closer read.
📊 The Dashboard — Wednesday, 12 August 2026 (closes)
| Gauge | Level | Move | What this means |
|---|---|---|---|
| STOXX 600 (pan-Europe) | 659.48 | 🔴 ▼ −0.16% | A small step off Tuesday's record — profit-taking near the top, not a change of story. |
| DAX (Germany) | 26,331.07 | 🔴 ▼ −0.23% | Touched a fresh intraday record near 26,574 in the morning, then handed it all back — the four-day advance ended. |
| FTSE 100 (UK) | 10,833.15 | 🔴 ▼ −0.10% | A third small slip, with Thursday's growth report still ahead. |
| CAC 40 (France) | ≈8,675 | 🔴 ▼ −0.46% | Rotation row: Paris took the biggest step back of the majors on a cautious day. |
| EUR/USD | ≈1.1525 | ⚪ ≈ flat | Still trading. An in-line US inflation number changes nothing about the gap between US and euro rates, so there was nothing to reprice. |
| GBP/USD | ≈1.3495 | ⚪ ≈ flat | Still trading. The pound met its GDP morning with a shrug — the headline matched forecasts almost to the decimal. |
| Bund 10Y yield | ≈3.15% | ⚪ −4 bp | Eased from Tuesday's run at 3.20% after US inflation cooled — the oil-inflation-yields chain from this week's issues, running in the friendly direction. |
Thursday, live: as of press time the STOXX 600 was back up at 660.62 (+0.17%), the DAX around 26,452 (+0.46%) — record territory again — while the FTSE 100 slipped roughly 0.4% toward 10,790, dragged by miners and energy shares as commodity prices fell. Brent crude was near $87.79, down about 1.3% — the first red day after six straight gains. These are intraday snapshots, not closes; Thursday's final board lands in tomorrow's issue.
What happened, in plain words
Wednesday came in two halves. The morning brought another reminder of the Middle East risk that has run through this week's issues: an attack on a cargo ship in the Bab el-Mandeb strait killed six crew members — the first such deaths in over a year — and Iran repeated that the Strait of Hormuz stays shut until its conditions are met. Oil held just under $90, its highest in a month.
The afternoon brought the number everyone had been parked in front of: US consumer prices rose 0.1% in July, taking annual inflation down to 3.4% from 3.5% — exactly the forecast. US stock futures rose and bond yields fell, and Germany's Bund yield eased with them, down about 4 basis points from Tuesday's brush with 3.20%. Yet Europe's stock indices still finished a shade lower. That combination — good news lands, prices slip anyway — usually has a boring explanation, and Wednesday's was: after a record-setting run, some investors sold simply to bank their gains. The textbook name is profit-taking, and it is why a red day at the top of the board reads differently from a red day at the bottom.
⭐ Spotlight: UK quarterly GDP growth — +0.4% (Q2 2026)
Gross domestic product is the total value of everything a country produces in a period, and the quarterly growth rate — published by the Office for National Statistics about six weeks after each quarter ends — is the closest thing an economy has to a report card. It sits on our board because the Bank of England steers interest rates against growth as well as inflation, so this number shapes what happens to the pound and to UK borrowing costs. This morning's card read +0.4% for April through June — slower than the first quarter's +0.6%, with business investment up 1.2% and household spending up 0.3% doing the pulling, while government spending fell, partly on school closures during June's heatwave.
📈 Chart of the Day — the months inside the quarter
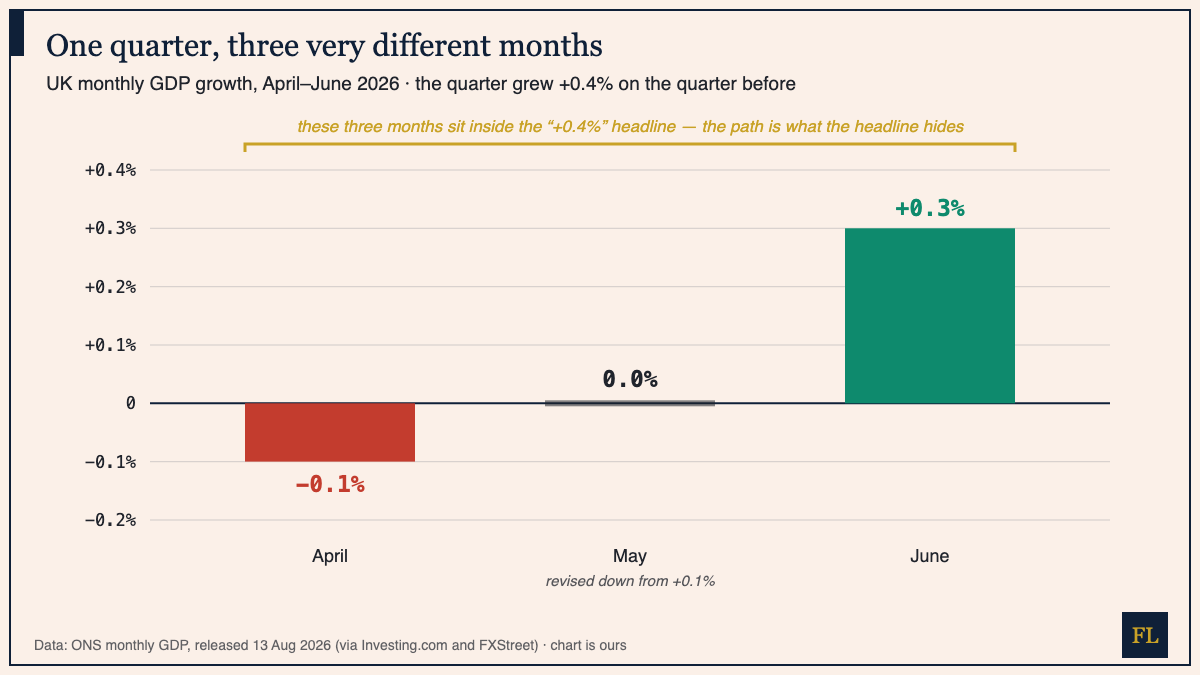
How to read this: the quarterly figure compares the whole quarter's output with the whole previous quarter's — so a strong finish to one quarter hands a head start to the next, and the headline can outrun the path inside it. Read the path here: April shrank, May flatlined, June rebounded +0.3% when forecasters expected zero. Add those up and you get less than half the +0.4% headline; the rest is that head start, carried over from early spring. Two habits follow. When a quarterly number lands, look at the latest month for the direction of travel — June's rebound is the forward-looking part of this report. And notice May: first published as +0.1%, now revised to 0.0. Early economic numbers are drafts, which is exactly why this page labels which of its own numbers are settled and which are still moving.
📅 This afternoon, then tomorrow
At 14:30 CET the US publishes July producer prices (PPI) — inflation measured at the factory gate rather than the checkout. After Wednesday's tame consumer number, traders will check whether the pipeline agrees; European bond yields will move if it doesn't. Tomorrow at the same hour brings US retail sales, a read on the world's biggest consumer. And keep one eye on the oil row: the International Energy Agency trimmed its demand forecast and the latest weekly US inventory report showed a 17.4-million-barrel jump — supply-and-demand data tugging the price down even while the Hormuz standoff tugs it up. Whether Thursday's pullback holds is the cleanest test this week of which force is winning.
We explain; we never advise. Nothing here is investment advice.
Financial Literature is for educational and informational purposes only. Nothing here is investment, financial, legal, or tax advice, or a recommendation to buy or sell any security. Content is impersonal and not tailored to any individual. Data may contain errors — verify before relying on it. Sources: Investing.com (STOXX 600, FTSE 100 daily closes); Trading Economics (DAX, CAC 40, Bund yield, EUR/USD, Brent); Hargreaves Lansdown (Europe close, London open); FXStreet and Investing.com (UK GDP/ONS); Yahoo Finance (US CPI).
— The Editorial Team