🌎 −0.6% — the shopper changed the subject
The S&P 500 crossed 7,800 for the first time — then July retail sales fell 0.6%. The week's story flips from prices to spending.


Compiled Friday, 14 August 2026, about 11:30 a.m. in New York (Eastern Time). Stock index rows are final Thursday closes; bond yields and currencies trade around the clock, so those rows are Friday-morning snapshots and labeled as such. The live paragraph beneath the table covers Friday's session so far.
Americans pulled back at the store: July retail sales fell 0.6% where forecasters expected a small gain — and the news landed the morning after the S&P 500's first trip above 7,800 in its history.
📊 The Dashboard — Thursday, 13 August 2026 (closes)
| Gauge | Level | Move | What this means |
|---|---|---|---|
| S&P 500 (500 big US firms) | 7,798.99 | 🟢 ▲ +0.7% | Final. A record close: the index crossed 7,800 for the first time during the session and finished a point beneath the line — first visits to round numbers rarely hold to the bell. |
| Nasdaq Composite (tech-heavy) | 26,803.03 | 🟢 ▲ +0.8% | Final. A second tame inflation print in two days did the lifting; up 0.4% for the week at Thursday's bell. |
| Dow (30 blue-chip firms) | 53,839.99 | 🟢 ▲ +0.1% | Final. Up 69.72 points — the only major board still red for the week (−0.4%) after four days. |
| Russell 2000 (2,000 smaller firms) | 3,052.85 | 🟢 ▲ +0.2% | Final. Rotation row: up 23% in 2026, still the year's best board — the rate-relief trade, compounding. |
| US 10-year Treasury yield | ≈4.67% | ⚪ easing | Friday snapshot. Down from Tuesday's 4.75% — a 19-month high — as the week's data cooled; a weak shopper number keeps it pinned today. |
| Dollar index (DXY) | ≈99.5 | ⚪ ▼ ≈0.4% | Friday snapshot. The dollar eased after the retail miss — softer demand, less pressure on the Fed to raise. |
| USD/CAD | ≈1.388 | ⚪ ≈ flat | Friday snapshot. Parked all week inside a half-percent band. |
| USD/MXN | ≈17.00 | ⚪ ≈ flat | Friday snapshot. The peso sits right at the 17 line; the dollar has lost about 5.7% against it this year — Tuesday's interest-gap lesson, still compounding. |
Friday, live: at press time the S&P 500 hovered just under Thursday's record, around 7,791 (−0.1%), with the Nasdaq and Dow fractionally lower — digesting the retail number, not fleeing it. Snapshots, not closes; Friday's final board lands in The Weekly Read.
What happened, in plain words
Thursday belonged to wholesale prices. The July Producer Price Index — what businesses charge each other, upstream of the checkout — came in flat against forecasts of a 0.2% rise: goods prices fell 0.7% while services rose 0.2%, and the annual rate stepped down to 4.7% from June's 5.5%. That made two friendly inflation surprises in two days, and the stock market did what it has done all year with rate relief — set a record, helped by crude oil easing 2.1% on the day. Even jobless claims rising to 209,000, a touch above forecasts, was read the same way: one more reason for the Fed to stay put. By Friday, futures priced about a 35% chance of a September rate rise, down from 55% a week earlier.
Then Friday morning changed the subject from prices to spending. Retail and food-service sales fell 0.6% in July to $763.6 billion — forecasters had penciled in roughly a 0.1% gain. The pullback was broad where it counts: car dealers −1.8%, online sellers −2.2%, gas stations −0.9% (pump prices fell in July — the same energy cooling Wednesday's CPI showed). Clothing stores (+1.9%) and restaurants (+0.5%) still rose, and sales remain 5.0% higher than a year ago — a slower shopper, not a stopped one. And this report's own fine print says to hold it gently; that fine print is today's spotlight.
⭐ Spotlight: retail sales — the advance estimate
Retail sales is the Census Bureau's monthly tally of receipts at stores, car dealers, gas stations and restaurants, published about two weeks after each month ends — the first broad look at the US consumer, whose spending is the main engine of the US economy. It sits on every watchlist because when the shopper slows, everything downstream slows later. But it earns its “advance estimate” label: it is built from a survey sample, July's print carries a margin of error of ±0.4 percentage points, and June's small gain was just revised to what the bureau calls statistically indistinguishable from zero — the government's own way of saying early numbers are drafts.
📈 Chart of the Day — one week, three report cards
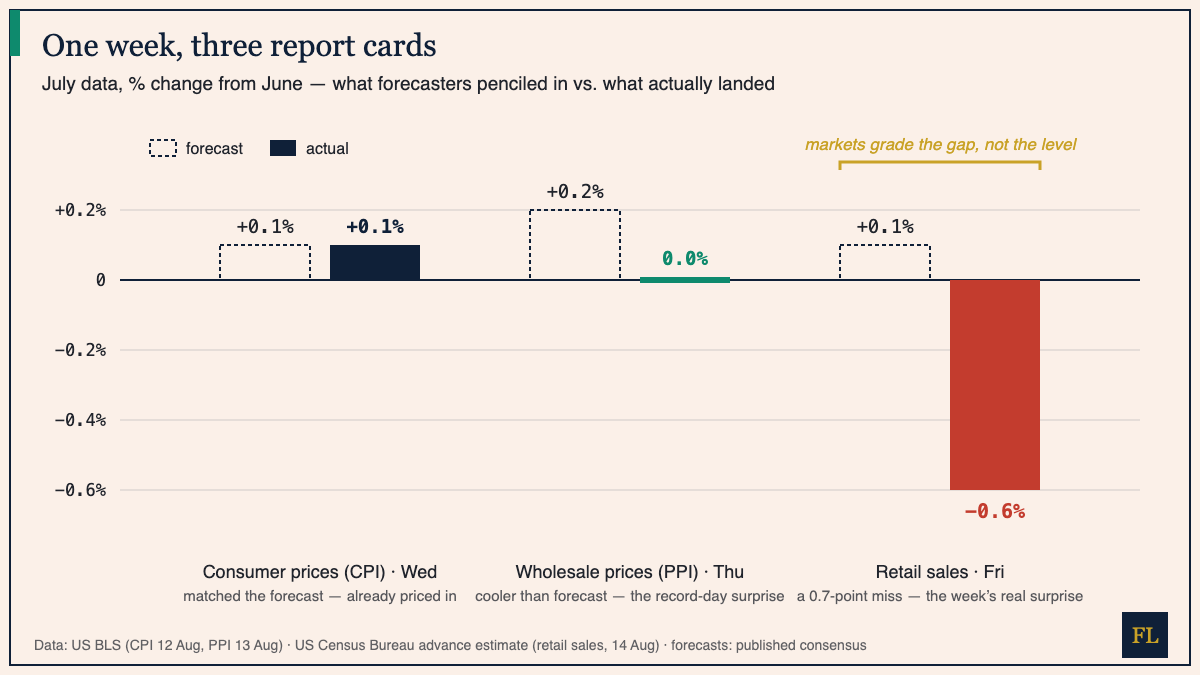
How to read this: each pair is one report — the dashed bar is the forecast, the solid bar is what landed, all on one axis. Wednesday's pair matches exactly, and the market barely moved: a matched forecast is already in prices — yesterday's “priced in” lesson, drawn. Thursday's solid bar undershoots in the friendly direction, and the S&P set a record on a 0.2-point surprise. Friday's is the week's only wide gap — 0.7 points, in the unfriendly direction for growth. The habit: when a number lands, ask what was expected and which way the gap points. Markets grade the gap, not the level.
📅 The weekend, then next week
The Weekly Read arrives this weekend with the full week's story. Next week the July-shopper question gets better evidence: on Wednesday the Fed publishes the minutes of its July 28–29 meeting — the fullest account yet of how the committee is leaning into September — and on Thursday before the open, Walmart reports quarterly results: an actual nationwide cash register, one week after the government's survey. Watch whether the two tell the same story about July.
We explain; we never advise. Nothing here is investment advice.
Financial Literature is for educational and informational purposes only. Nothing here is investment, financial, legal, or tax advice, or a recommendation to buy or sell any security. Content is impersonal and not tailored to any individual. Data may contain errors — verify before relying on it. Sources: AP via Yahoo Finance (index closes, weekly and yearly context); Yahoo Finance (Thursday session, jobless claims, Friday snapshot); Reuters via Yahoo Finance (July PPI); Yahoo Finance (July CPI); Yahoo Finance/Census Bureau (July retail sales); Trading Economics (10-year yield, rate odds, currencies); EqualsMoney (Fed minutes calendar); Business Wire via StockTitan (Walmart earnings date).
— The Editorial Team