🌎 3.75–4% — the Fed's first rise since 2023, and 16 of 18 dots sit above it
A 12–0 vote, the first rise since July 2023. Read the new dots against the new range: 16 of 18 officials see December's rate above it.

Compiled Thursday, 17 September 2026, about 7:20 a.m. in New York (Eastern Time). A 4-min read. Every row in the table is Wednesday's final close or settle; the currency and oil levels this morning, still trading, are in the notes.
Yesterday's answer: B. A dot at 3.875% sits on the midpoint of a 3.75–4.00% range, so it means no further change, and the eight dots above it are the officials who see more rises. A read the dot against the old range; C treated a set of opinions as a promise. The real plot, published at 2 p.m., leaned further than that made-up one: only two of 18 dots sit at 3.875%, and 16 sit above it.
The Federal Reserve raised its target range for the federal funds rate, the rate banks charge each other for overnight loans, by a quarter point to 3.75–4.00% on Wednesday, by a 12–0 vote. It is the first rise since July 2023. The new projections point higher still: 12 of 18 officials see one more quarter-point rise by December, and four see two. "The plain fact is that inflation is too high and has been for too long," Chair Kevin Warsh said in his opening statement. Stocks had been steady until he spoke, Kiplinger reported; the Dow closed 1.2% lower and the dollar index rose 0.6%.
📊 The Dashboard
| Gauge | Level | Move | What this means |
|---|---|---|---|
| S&P 500 (500 big US firms) | 7,551.81 | 🔴 ▼ −0.45% | Down 33.92 points, and 1.4% lower since Friday. |
| Nasdaq Composite (tech-heavy) | 25,978.42 | 🔴 ▼ −0.01% | Down 3.15 points: effectively flat, the steadiest of the four boards. |
| Dow (30 blue-chip firms) | 51,461.90 | 🔴 ▼ −1.21% | Down 631.21 points, the largest fall of the four, and 2.1% since Friday. |
| Russell 2000 (2,000 smaller firms) | 2,858.81 | 🔴 ▼ −0.40% | Down 1.6% since Friday, a little more than the S&P 500. |
| US 2-year Treasury yield | 4.74% | 🔴 ▲ +7 bp | From 4.67%. The yield most tied to the Fed's next few moves rose the most. Red because a higher yield means a lower price for bonds already issued. |
| US 10-year Treasury yield | 5.01% | 🔴 ▲ +1 bp | From 5.00%. Its gap over the two-year shrank to 27 bp, from 33 bp on Tuesday. |
| Dollar index (DXY) | 100.25 | ⚪ ▲ +0.64% | The dollar against six major currencies. About 100.2 this morning. |
| USD/CAD | 1.3989 | ⚪ ▲ +0.50% | Loonie weaker: more Canadian dollars per US dollar. About 1.399 this morning. |
| USD/MXN | 17.243 | ⚪ ▲ +0.56% | Peso weaker. About 17.21 this morning, a little of the move undone. |
| Brent crude | $105.83 | ⚪ ▼ −2.69% | Wednesday's settle, from $108.75. About $103.5 this morning. |
What happened, in plain words
A rate rise makes short-term borrowing dearer first, which is why the two-year yield rose far more than the ten-year. The rise itself was expected; the message that more may follow was the news. "This summer's inflation readings do not tell me that underlying trends have meaningfully improved," Warsh said. The morning's data had pointed the same way: retail sales rose 1.2% in August, above the 0.7% economists expected, per FactSet. Those figures are not adjusted for price changes, so dearer petrol lifts them as well as busier shops.
⭐ Spotlight: the rate on reserves, 3.90% from today
Banks keep about $3 trillion on deposit at the Federal Reserve, and from today the Fed pays them 3.90% a year on it, up from 3.65%, per the implementation note that came with the decision. A bank has little reason to lend overnight to another bank for less than the Fed pays it to wait, so this rate does most of the work of pulling the market rate, the effective federal funds rate, into the range: it printed 3.63% every day from 8 to 15 September, just under the 3.65% then paid on reserves. Two more settings box it in: the Fed takes overnight cash from money-market funds and others at 3.75%, the bottom of the new range, and lends overnight against Treasuries and similar bonds at 4.00%, the top. The daily effective rate, with its volumes, is free on NY Fed Markets Data on the Data Catalog.
📈 Chart of the Day: the same dots, a new range
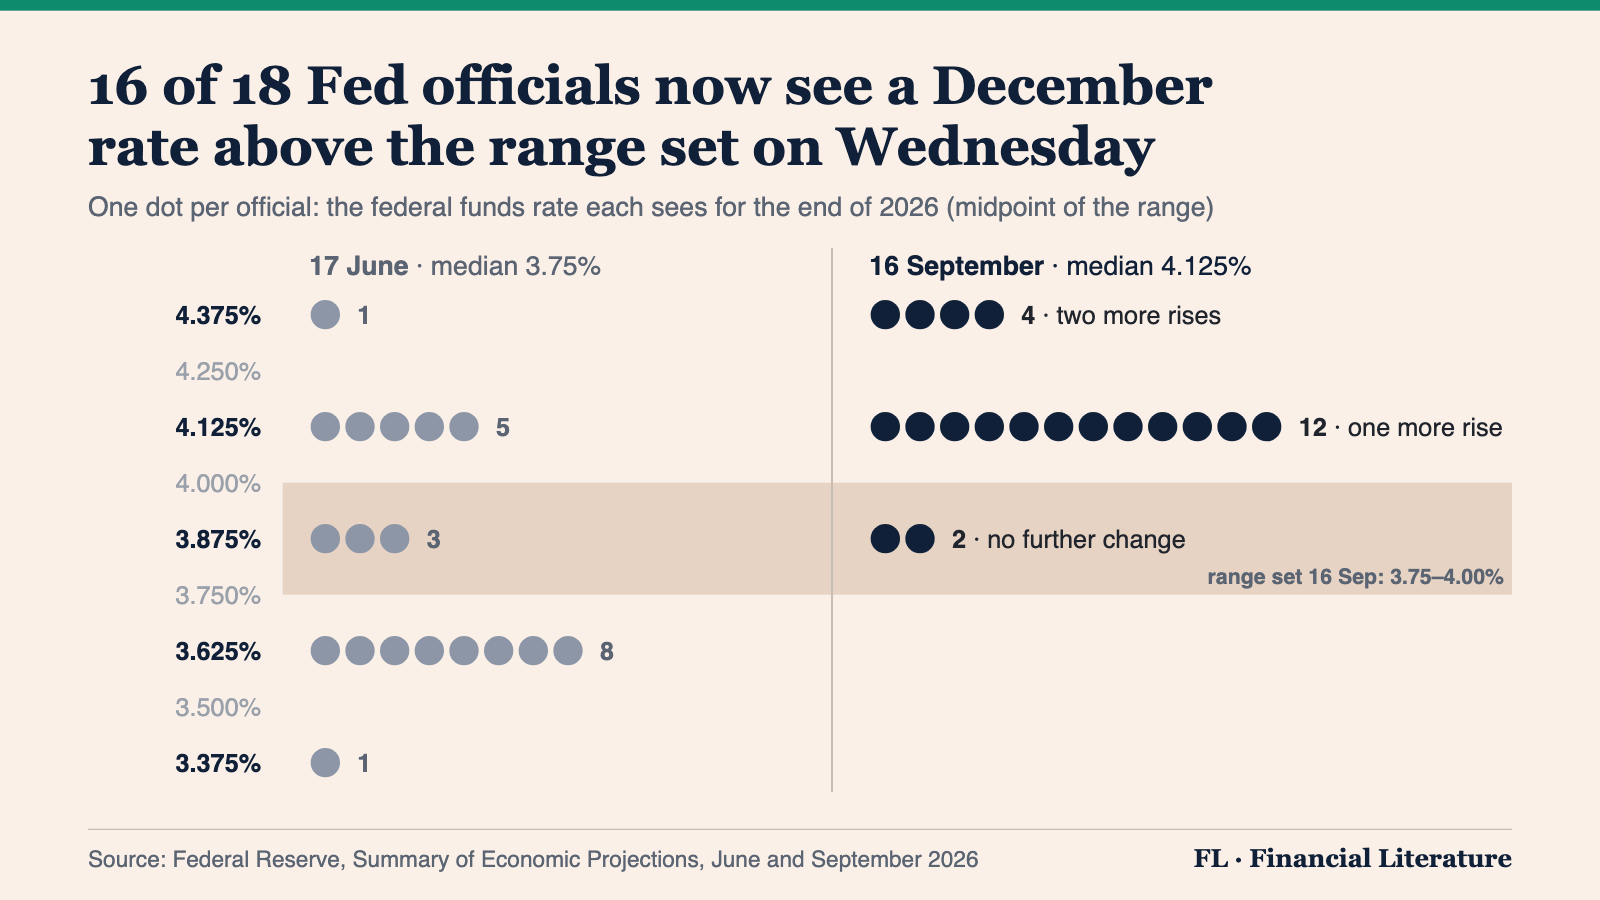
How to read this. A dot is a level, not a number of moves. To turn it into moves, start from the midpoint of the range in force on the day the plot was drawn and count quarter points: against Wednesday's 3.875%, a dot at 4.125% is one more rise and 4.375% is two. June's plot needs June's midpoint, 3.625%, so its eight dots there meant no change at the time, not a cut. Two meetings are left this year, 27–28 October and 8–9 December, so the 12 middle dots describe one rise at one of those two.
📅 Tomorrow
Thursday at 8:30 a.m. Eastern: weekly jobless claims and the Philadelphia Fed's factory survey, the first data since the decision. On Friday at about 9 a.m., the New York Fed publishes Thursday's effective federal funds rate, the first day of the new 3.90% on reserves; read it against that rate, as the Spotlight did with last week's 3.63%. Wednesday's letter showed how to count the dots.
One question. Today's chart turned dots into moves by counting quarter points from the midpoint of the range in force. Suppose one official's June dot sat at 3.625%, when the range was 3.50–3.75%, and the same official's September dot sits at 4.125%, with the range now 3.75–4.00%. Which reading is right? A: in June the official saw no change by December, and now sees one more rise. B: the official now sees two more rises, because 4.125% is half a point above 3.625%. C: the official saw a cut in June, because 3.625% is below today's range.
Forwarded this by a friend? Subscribe here. Found it useful? Forward it to one person who'd want it.
We explain; we never advise. Nothing here is investment advice.
Financial Literature is for educational and informational purposes only. Nothing here is investment, financial, legal, or tax advice, or a recommendation to buy or sell any security. Content is impersonal and not tailored to any individual. Data may contain errors, so verify before relying on it. Sources: Federal Reserve Summary of Economic Projections, September 2026; June 2026; US Treasury daily par yields; New York Fed; AP closing table; US Census Bureau; CNBC; Investing.com.
— The Editorial Team