🌎 S&P 500 +1.1% the day after the hike, as jobless claims fell to 196,000
Oil and Treasury yields eased and stocks rebounded. Jobless claims fell to 196,000, and the time of year explains most of the raw drop.


Compiled Friday, 18 September 2026, about 7:25 a.m. in New York (Eastern Time). A 4-min read. Every row in the table is Thursday's final close or settle; the currency and oil levels this morning, still trading, are in the notes.
Yesterday's answer: A. Each dot is read against the midpoint of the range in force on the day it was drawn: 3.625% was June's midpoint, so that dot meant no change, and 4.125% sits a quarter point above today's 3.875%, so it means one more rise. B counts Wednesday's rise twice; C reads a June dot against today's range.
US stocks rebounded on Thursday, the day after the Federal Reserve's first rate rise since 2023: the S&P 500 rose 1.1%, its best day in six weeks, AP reported, and the Nasdaq Composite 1.7%. The two pressures of the week both eased. Brent crude slipped 1%, and the 10-year Treasury yield fell back below 5%, to 4.94%, its first fall after eight straight daily rises. First-time claims for unemployment benefits fell to 196,000.
📊 The Dashboard
| Gauge | Level | Move | What this means |
|---|---|---|---|
| S&P 500 (500 big US firms) | 7,637.76 | 🟢 ▲ +1.14% | Up 85.95 points, more than Wednesday's 33.92-point fall. Still 0.3% lower since Friday. |
| Nasdaq Composite (tech-heavy) | 26,418.30 | 🟢 ▲ +1.69% | Up 439.87 points, the biggest gain of the four. Now 0.3% higher since Friday. |
| Dow (30 blue-chip firms) | 51,778.04 | 🟢 ▲ +0.61% | Up 316.14 points, about half of Wednesday's 631-point fall. Still 1.5% lower since Friday. |
| Russell 2000 (2,000 smaller firms) | 2,874.63 | 🟢 ▲ +0.55% | Up 15.82 points; 1.0% lower since Friday. |
| US 2-year Treasury yield | 4.67% | 🟢 ▼ −7 bp | From 4.74%, back to Tuesday's level: Wednesday's whole rise undone. Green because a lower yield means a higher price for bonds already issued. |
| US 10-year Treasury yield | 4.94% | 🟢 ▼ −7 bp | From 5.01%. Its gap over the two-year stayed at 27 bp: both fell the same distance. |
| Dollar index (DXY) | 100.25 | ⚪ 0.00% | The dollar against six major currencies, flat on the day. About 100.4 this morning. |
| USD/CAD | 1.3991 | ⚪ ▲ +0.01% | Flat. About 1.400 this morning, a little more Canadian dollars per US dollar. |
| USD/MXN | 17.167 | ⚪ ▼ −0.47% | Peso firmer, most of Wednesday's 0.59% slide undone. About 17.15 this morning. |
| Brent crude | $104.82 | ⚪ ▼ −0.95% | Thursday's settle, from $105.83; it was near $110 on Tuesday. About $103 this morning. |
What happened, in plain words
Oil and bond yields had been squeezing shares all week, and on Thursday both let go a little. Brent had neared $110 on worries that the war with Iran keeps oil in the Middle East, per AP. A lower yield makes profits expected years from now worth more today, which helps fast-growing tech firms most, so the Nasdaq led: AMD rose 6.4% and Nvidia 2.5%. The Philadelphia Fed's factory survey eased to 37.8 from 47.4. It is the share of firms reporting more activity minus the share reporting less, so zero is its dividing line and 37.8 still means far more firms growing than shrinking. Its prices-paid gauge rose 8 points to 48.6.
⭐ Spotlight: initial jobless claims, 196,000
Every Thursday at 8:30 a.m. the Labor Department counts the people who filed a first claim for unemployment benefits in the week before. It is the most frequent official read on layoffs in the US, one week old rather than one month. In the week to 12 September, 196,000 filed, down 10,000 and below the 208,000 economists expected, per FXStreet; a year earlier it was 233,000. One week can be moved by a holiday, a storm or one state's backlog, so the department also prints a four-week average, 203,250. The weekly series runs back to 1967 and is free on FRED on the Data Catalog.
📈 Chart of the Day: two counts for one week
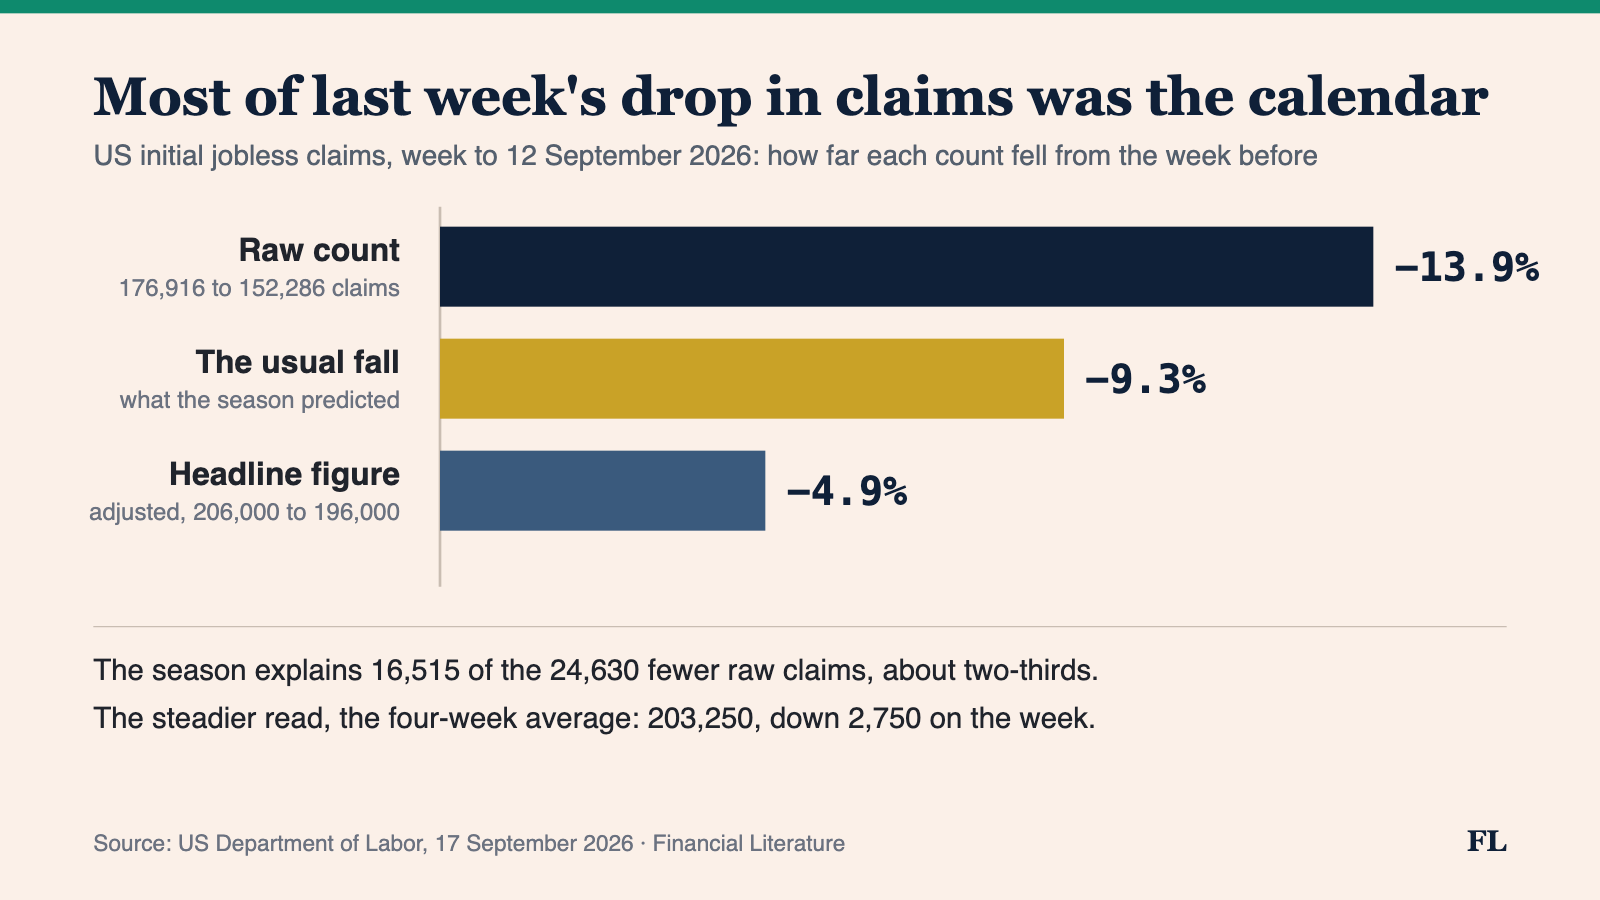
How to read this. Every week the Labor Department prints two counts. The raw count is the claims state offices actually took in; the headline is seasonally adjusted, which strips out what normally happens in that week of the year. Read the raw change against the usual change: raw claims fell 13.9% when the season alone predicted 9.3%, so the headline fell by roughly the gap between them. If the raw count falls by less than the season predicts, the adjusted figure rises, even though fewer people filed.
📅 Tomorrow
Friday brings no major US data release. The S&P 500's quarterly changes take effect before Monday's open, so Friday is the last session on the old list: Bloom Energy, Everpure and Illumina join; Molson Coors, The Trade Desk and Builders FirstSource leave. At about 9 a.m. the New York Fed publishes Thursday's effective federal funds rate, the first day of the new 3.90% paid on reserves; the next issue reads it. Wednesday's letter followed the 10-year to 5%.
One question. Today's chart read a raw count against the fall the season predicts. Suppose next week's raw count of claims falls 5%, while the seasonal factors expect a 9% fall for that week. Which reading is right? A: the headline falls, because fewer people filed. B: the headline rises, because the raw count fell by less than that week usually brings. C: the headline is unchanged, because both numbers fell.
Forwarded this by a friend? Subscribe here. Found it useful? Forward it to one person who'd want it.
We explain; we never advise. Nothing here is investment advice.
Financial Literature is for educational and informational purposes only. Nothing here is investment, financial, legal, or tax advice, or a recommendation to buy or sell any security. Content is impersonal and not tailored to any individual. Data may contain errors, so verify before relying on it. Sources: US Department of Labor, weekly claims; Philadelphia Fed; US Treasury daily par yields; AP closing table; S&P Dow Jones Indices; CNBC; Investing.com.
— The Editorial Team