How do you read the Fed's dot plot?
One dot per official, four times a year. Count the dots against the range in force the day they were drawn, and read the median last.

One dot per official, four times a year. Count the dots against the range in force the day they were drawn, and read the median last.

Oil and Treasury yields eased and stocks rebounded. Jobless claims fell to 196,000, and the time of year explains most of the raw drop.
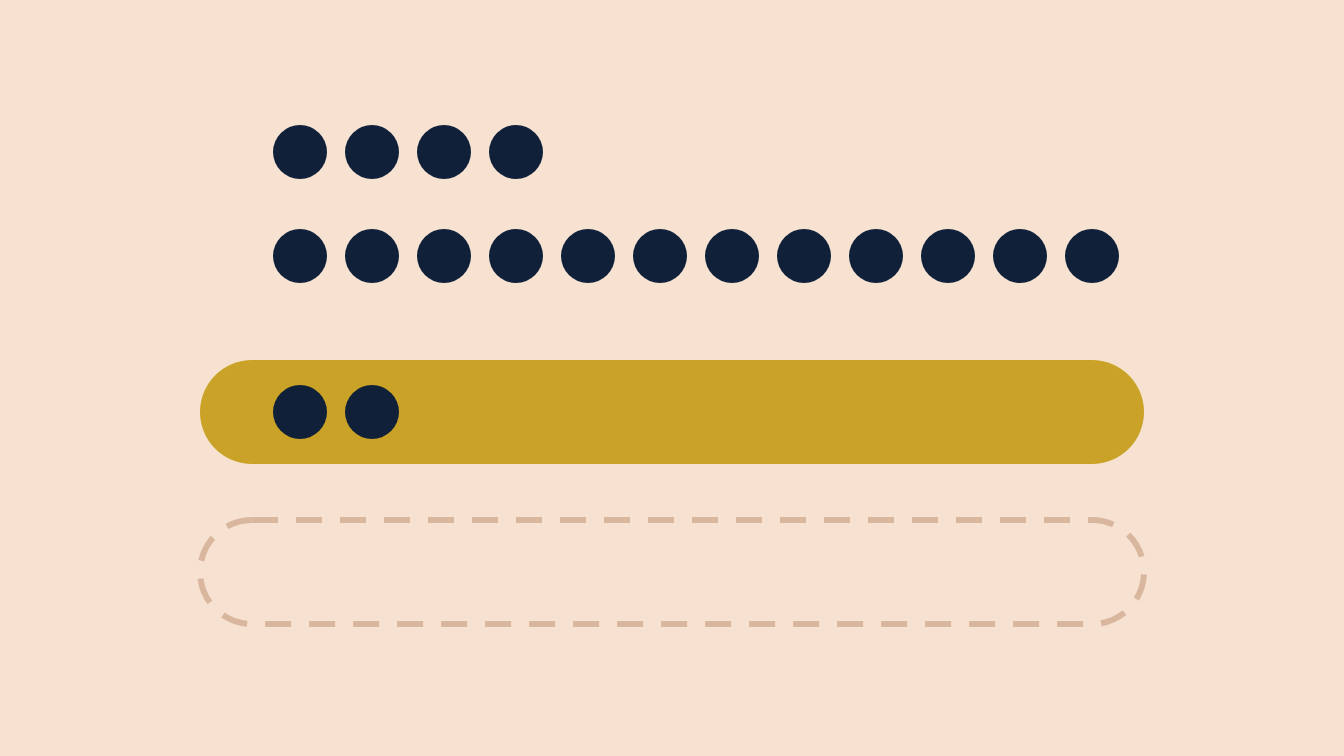
A 12–0 vote, the first rise since July 2023. Read the new dots against the new range: 16 of 18 officials see December's rate above it.
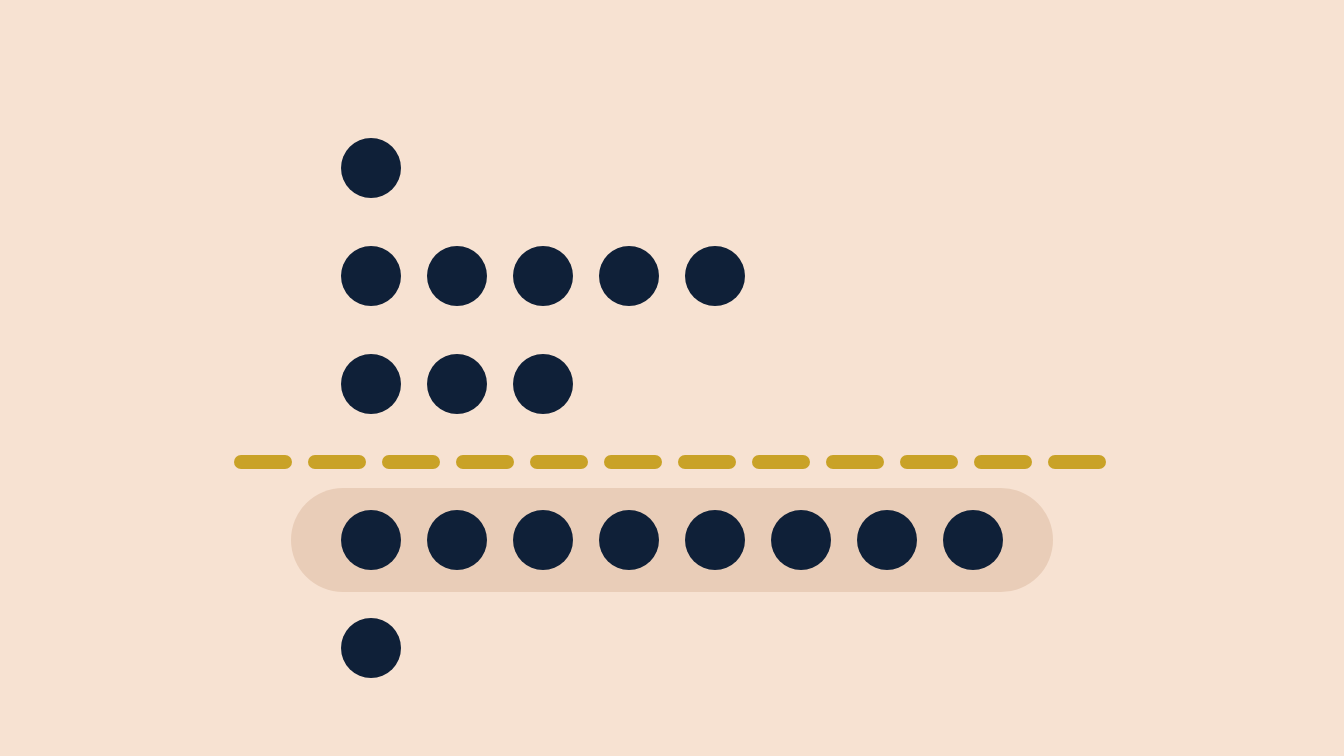
The 10-year Treasury yield closed at 5.00% before today's Fed decision. How to read the 2 p.m. dot plot: count the dots, not only the median.
An AI slowdown call from the labs themselves, Brent past $109 and a Fed expected to raise on Wednesday, plus the options market's price for a normal day.
CPI, PCE and PPI measured the same July and printed three different rates. What each one asks, why they disagree, and which one carries the Fed's target.
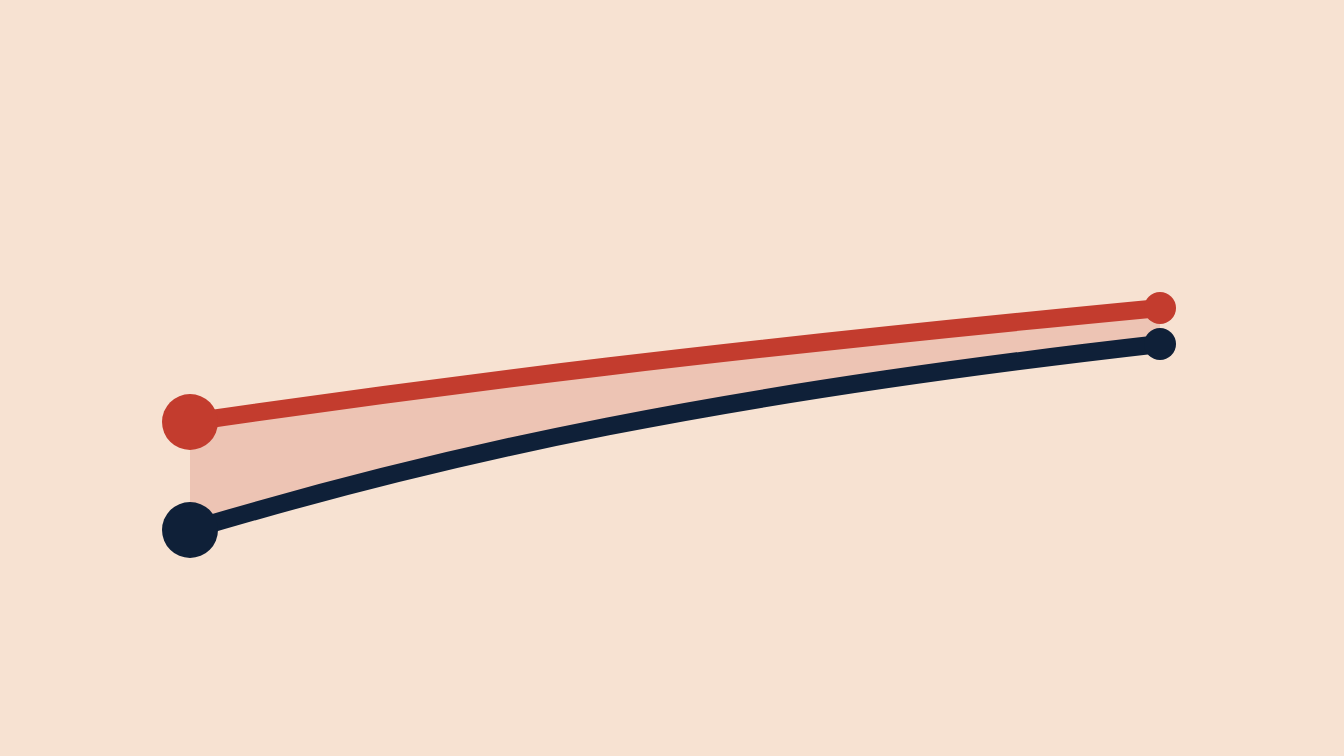
August consumer prices, Friday's rebound inside a losing week, and a Treasury curve that moved most where the Fed's next few meetings live.
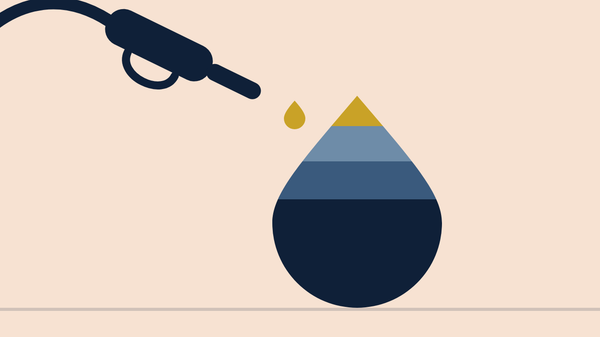
Brent closed at $101.21 on Wednesday, back above $100 for the first time since July. Crude is about half the price of a gallon, so the pump moves less.
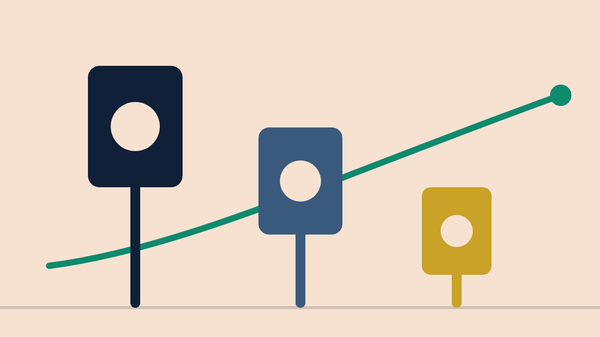
The Dow fell 628 points on Tuesday and Brent went above $100 this morning. In between, the Treasury sold $58bn of three-year notes at 4.474%.
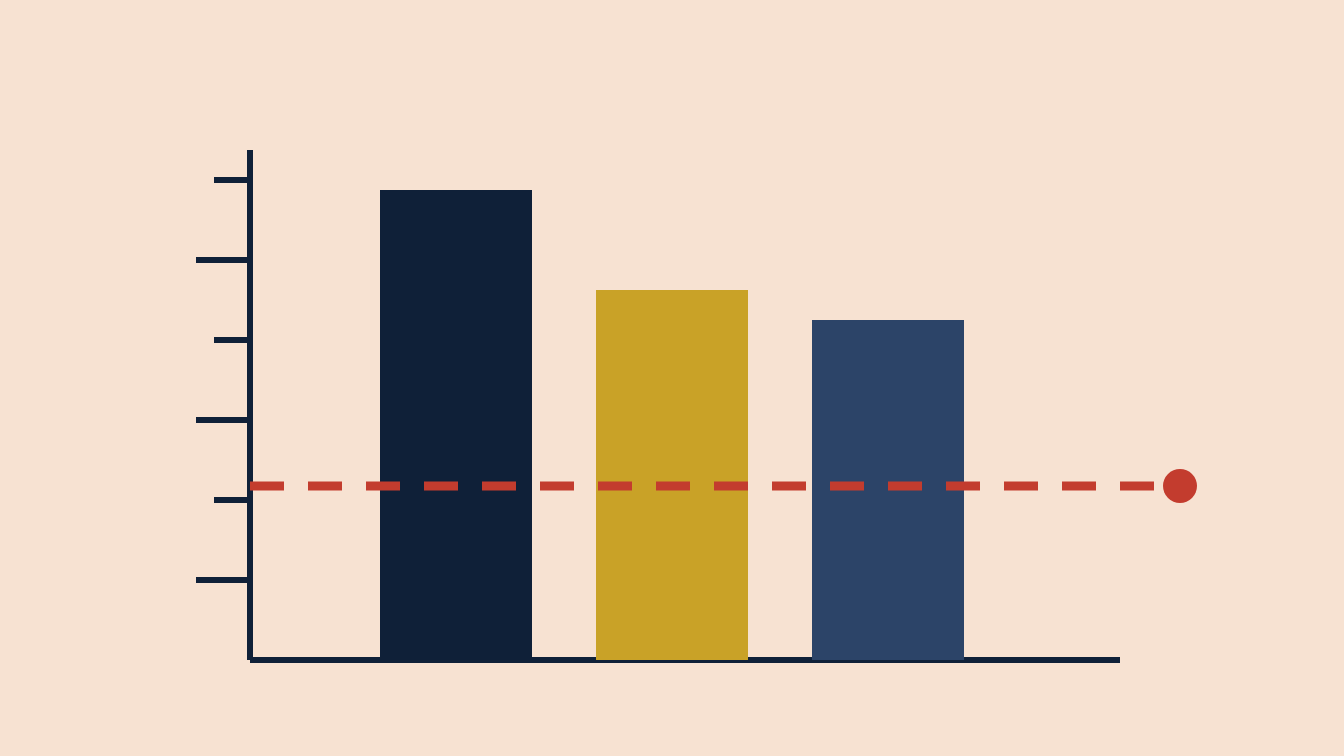
Wall Street reopens with oil near six-week highs. July inflation reads 3.4% on the CPI, 3.7% on the PCE index and 4.7% on the PPI.

US payrolls rose 162,000 in August against about 53,000 expected, with June and July revised up 55,000. New York and Toronto are shut for Labor Day.
Purchasing managers answer better, same or worse. How that becomes one number, why 50 is the line, and why the headline can hide a part below it.