🌎 The 10-year yield hit 5%, a level last seen in 2007, as the Fed decides
The 10-year Treasury yield closed at 5.00% before today's Fed decision. How to read the 2 p.m. dot plot: count the dots, not only the median.

Compiled Wednesday, 16 September 2026, about 7:30 a.m. in New York (Eastern Time). A 4-min read. The stock and 10-year rows are Tuesday's final closes; the currency and oil rows are Wednesday-morning snapshots, still trading as this was written.
Yesterday's answer (Monday's question): B. A VIX of 24 divided by 16 prices a typical day at about 1.5% in either direction. The band says nothing about direction, so A is wrong, and roughly one day in three should land outside it, so C is wrong. Both sessions since stayed inside their bands: the S&P 500 fell 0.48% on Monday against a band of 0.99%, and 0.45% on Tuesday against 1.07%.
The yield on the US 10-year Treasury note closed at 5.00% on Tuesday, the first time the Treasury's daily table has shown 5% since July 2007, and the Federal Reserve announces its rate decision at 2 p.m. today. Oil did much of the pushing. Brent settled at $108.75 a barrel, up 2.9%, after reports of fresh strikes on Saudi Arabia by Iran-backed Houthi forces, with the kingdom's pipeline around the Strait of Hormuz already shut. A quarter-point rise today is almost fully priced in futures markets, and it would be the Fed's first increase since July 2023. The S&P 500 fell for the sixth time in seven sessions.
📊 The Dashboard
| Gauge | Level | Move | What this means |
|---|---|---|---|
| S&P 500 (500 big US firms) | 7,585.73 | 🔴 ▼ −0.45% | Tuesday's close, down 34.25 points. Down 0.9% since Friday. |
| Nasdaq Composite (tech-heavy) | 25,981.57 | 🔴 ▼ −0.78% | The largest fall of the four boards for a second day, 1.3% since Friday. |
| Dow (30 blue-chip firms) | 52,093.11 | 🔴 ▼ −0.63% | Down 328.09 points. The points look big because the level is high; the percentage is the fair comparison. |
| Russell 2000 (2,000 smaller firms) | 2,870.29 | 🔴 ▼ −0.76% | Down 1.2% since Friday, close behind the Nasdaq. |
| US 10-year Treasury yield | 5.00% | 🔴 ▲ +3 bp | Tuesday's close on the Treasury's table, from 4.97%. About 4.98% this morning. Red because a higher yield means a lower price for bonds already issued. |
| Dollar index (DXY) | 99.7 | ⚪ ▲ slightly higher | Snapshot, little changed from Tuesday's close near 99.6. Barely moving before the decision. |
| USD/CAD | 1.393 | ⚪ ▲ loonie a touch softer | Snapshot, from about 1.392 at Tuesday's close. |
| USD/MXN | 17.13 | ⚪ flat | Snapshot, little changed from Tuesday. |
| Brent crude | about $107 | ⚪ ▼ lower | Snapshot, still trading. Tuesday's settle was $108.75, up 2.9%. |
What happened, in plain words
A 10-year yield is what the US government pays to borrow for a decade, and it rises when investors expect more inflation or a higher Fed rate over those years. Dearer oil feeds the first and an expected rise feeds the second, so both pushed the same way. The Treasury paid it directly: Tuesday's $13bn sale of 20-year bonds cleared at 5.420%, against 5.204% when the same bond was first sold in August, per TreasuryDirect. Factories feel the costs too: New York manufacturers' prices-paid index rose to 63.1 in September, just above May's four-year high, while the headline activity index fell to 7.6 from 20.6. The Treasury's par-yield table back to 1990 is free, with the pull recipe, on US Treasury data on the Data Catalog.
⭐ Spotlight: the dot plot, 3.75% for end-2026 in June
Four times a year the Fed publishes a chart with one dot for each official at the rate-setting table: the Board's governors and the 12 regional bank presidents. Each dot is that official's view of where the federal funds rate should sit at the end of this year, of each of the next few years, and over "the longer run", written as the midpoint of the target range. The Fed describes them as projections made "under their individual assumptions of projected appropriate monetary policy": a set of opinions, not a vote and not a promise, and no dot carries a name.
People track it because it is the only place the committee shows how far apart its members are. In June the median for end-2026 was 3.8% in the Fed's table, up from 3.4% in March (3.75% before rounding, the average of the two middle dots), and the officials' median for this year's PCE inflation rose to 3.6% from 2.7%. Today's set replaces both at 2 p.m.
📈 Chart of the Day: count the dots
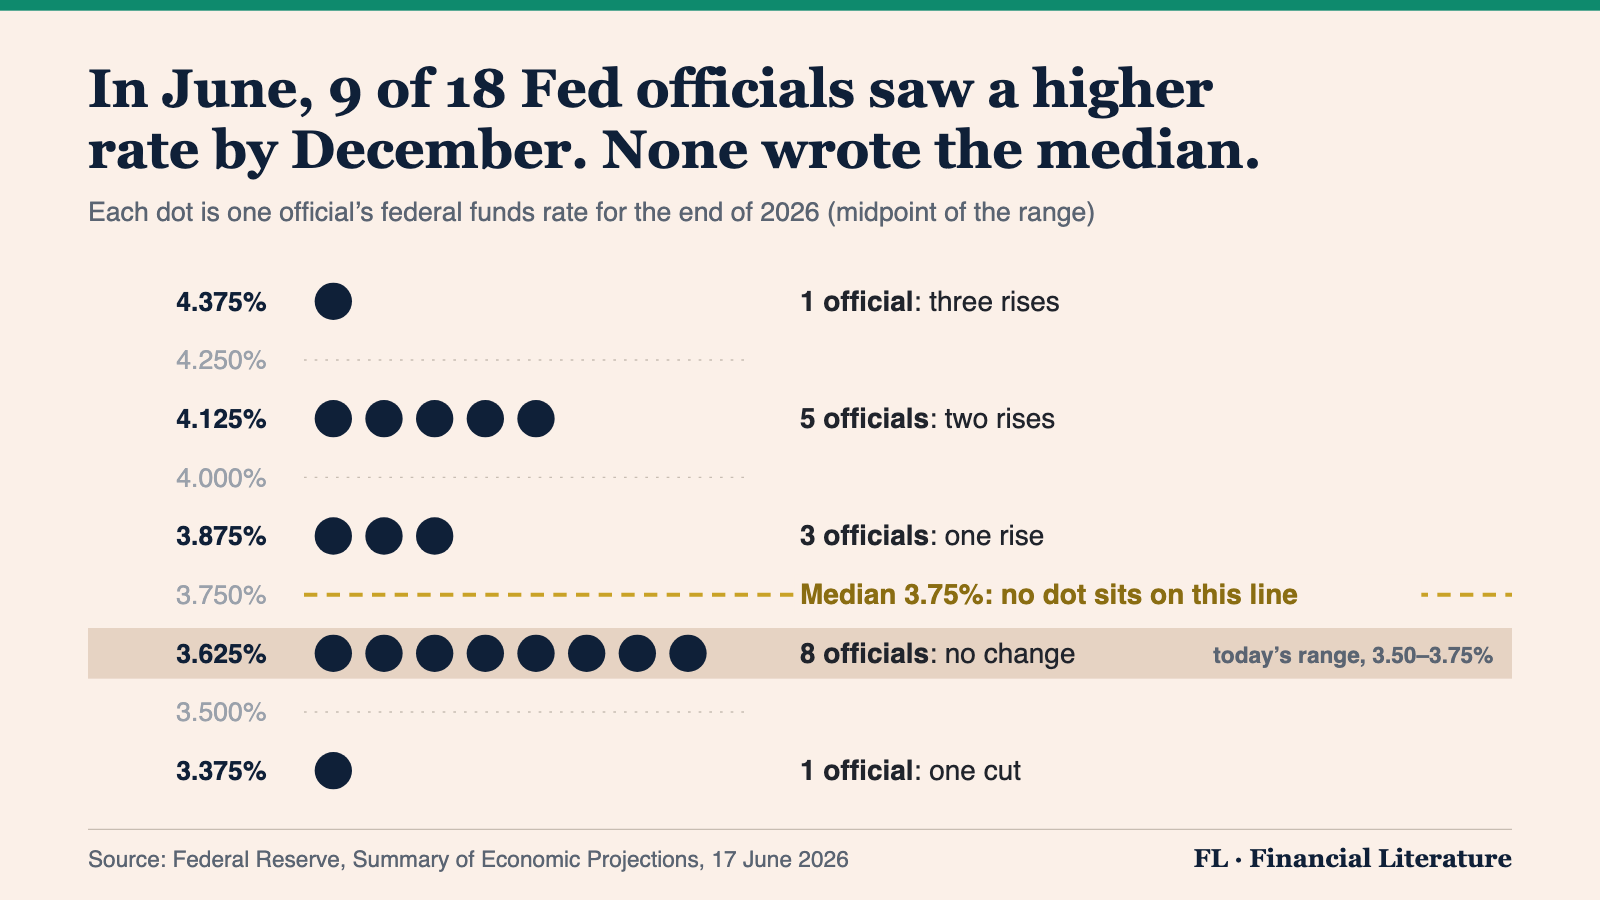
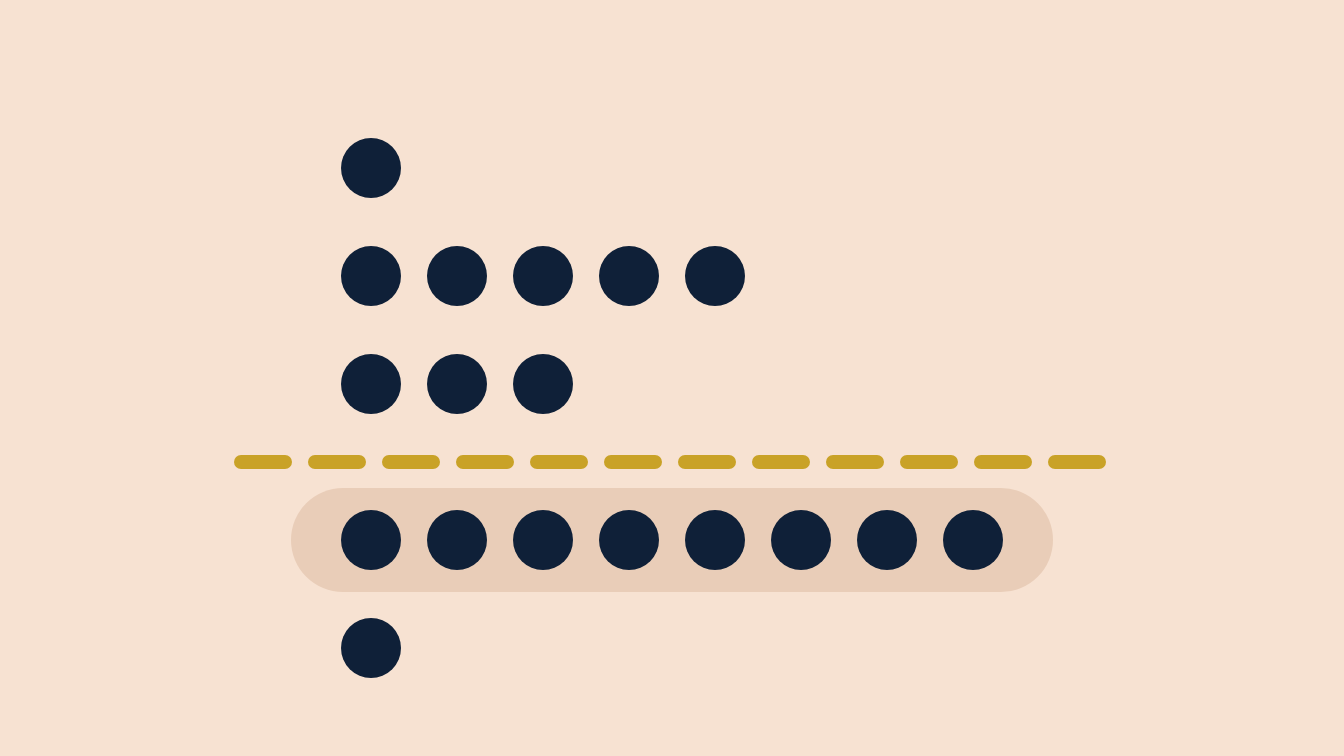
How to read this. Count the dots before you read the median. With 18 officials, the median is the average of the ninth and tenth dots, so it can land where nobody is. In June eight dots sat at 3.625%, today's midpoint, and nine above it, so a median of 3.75% described a committee split almost down the middle, not one agreed rise. Then read each dot against the range in force after the decision: if the range moves up a quarter point today, a dot at 3.875% stops meaning "one rise" and starts meaning "no further change".
📅 Tomorrow
Wednesday at 8:30 a.m. Eastern, the Census Bureau publishes August retail sales. At 2 p.m. (3 a.m. Thursday in Seoul) the Fed releases its statement and new projections, and Chair Kevin Warsh takes questions at 2:30, per the Fed's September calendar. Count the dots above the new range as well as the median. The projections measure inflation with PCE, the gauge Saturday's letter set beside CPI.
One question. Today's chart showed a median landing between two rows of dots. Suppose a made-up plot, drawn after the range has risen to 3.75–4.00%, shows ten dots at 3.875%, six at 4.125% and two at 4.375% for the end of the year. Which reading is right? A: the median of 3.875% means one more rise this year. B: the median sits at the new range's midpoint, so the middle official sees no further change this year, while eight of 18 see at least one more rise. C: the dots are a promise that rates will rise again this year.
Forwarded this by a friend? Subscribe here. Found it useful? Forward it to one person who'd want it.
We explain; we never advise. Nothing here is investment advice.
Financial Literature is for educational and informational purposes only. Nothing here is investment, financial, legal, or tax advice, or a recommendation to buy or sell any security. Content is impersonal and not tailored to any individual. Data may contain errors, so verify before relying on it. Sources: US Treasury daily par yields; Federal Reserve Summary of Economic Projections, June 2026; New York Fed; AP closing table; Cboe VIX daily history; CNBC; Yahoo Finance; Investing.com.
— The Editorial Team