🌎 −0.9% — the relief lasted one day
Long yields climbed back, oil rose on an Iran threat, Walmart fell 9% on a sales miss, and the S&P 500 lost 0.9% — its worst day in three weeks. Decoded.

Compiled Friday, 21 August 2026, about 7:30 a.m. in New York (Eastern Time), before the opening bell. Stock index rows are final Thursday closes, cross-checked against two settled sources; bond yields, currencies and oil trade around the clock, so those rows are Friday-morning snapshots and labeled as such.
Wednesday's relief lasted one day: Thursday the long-term yields the Treasury had tried to calm climbed back, oil rose on a new Iran threat, Walmart had its worst day in years, and the S&P 500 fell 0.9% — the market's worst loss in three weeks.
📊 The Dashboard — Thursday, 20 August 2026 (closes)
| Gauge | Level | Move | What this means |
|---|---|---|---|
| S&P 500 (500 big US firms) | 7,641.16 | 🔴 ▼ −0.9% | Final. Down 66.82 points; Investing.com's settled row shows −0.87% to the same level. Four losses in five days; about 1.9% lower on the week so far. |
| Nasdaq Composite (tech-heavy) | 26,067.17 | 🔴 ▼ −1.0% | Final. Down 263.92 points — it gave back Wednesday's small gain and then some, but this was not a tech-only day. Everything fell. |
| Dow (30 blue-chip firms) | 52,759.21 | 🔴 ▼ −1.3% | Final. Down 703.84 points — the day's worst big board, because one of its 30 members, Walmart, lost about 9%. Thirty stocks means one stock matters. |
| Russell 2000 (2,000 smaller firms) | 2,992.43 | 🔴 ▼ −1.3% | Rotation row, final. Wednesday's best board was Thursday's joint worst — the mirror image of relief. When long-term borrowing costs rise again, the firms that borrow most give back most. |
| US 10-year Treasury yield | ≈4.71% | 🔴 ▲ higher again | Friday snapshot. Settled at 4.65% Wednesday after the buyback news, rose about 4 basis points Thursday, and trades around 4.7% this morning — almost exactly where it was before the Treasury spoke. |
| Dollar index (DXY) | ≈98.6 | 🔴 ▼ near 3-month low | Friday snapshot. Still below 99. Odd pairing to learn from: yields up, dollar down. Higher yields driven by debt and oil worries do not attract money the way higher yields driven by growth do. |
| USD/CAD | ≈1.374 | 🔴 ▼ ≈0.4% | Friday snapshot. The pair kept falling — a second day below the 1.38–1.39 band it held for a month. Oil near $87 and a soft dollar both favor the loonie. |
| USD/MXN | ≈16.90 | 🔴 ▼ ≈0.3% | Friday snapshot. The peso firmed under 16.90; the pair has lost about 2.9% over four weeks. Quietly, the peso is having a very good month. |
What happened, in plain words
Read Thursday as Wednesday in reverse. On Wednesday the Treasury said it would at least double its buybacks of 10-to-30-year bonds, long yields fell, and stocks rose 0.2%. On Thursday, Treasury Secretary Scott Bessent said the buybacks "could exceed $4 billion" per operation — a bigger promise — and yields rose anyway. The 30-year climbed about 4 basis points back to roughly 5.24%; this morning it sits near 5.25%. The 10-year did the same, back to about 4.7%. As Trading Economics put it, the market decided the plan "may provide only a temporary solution."
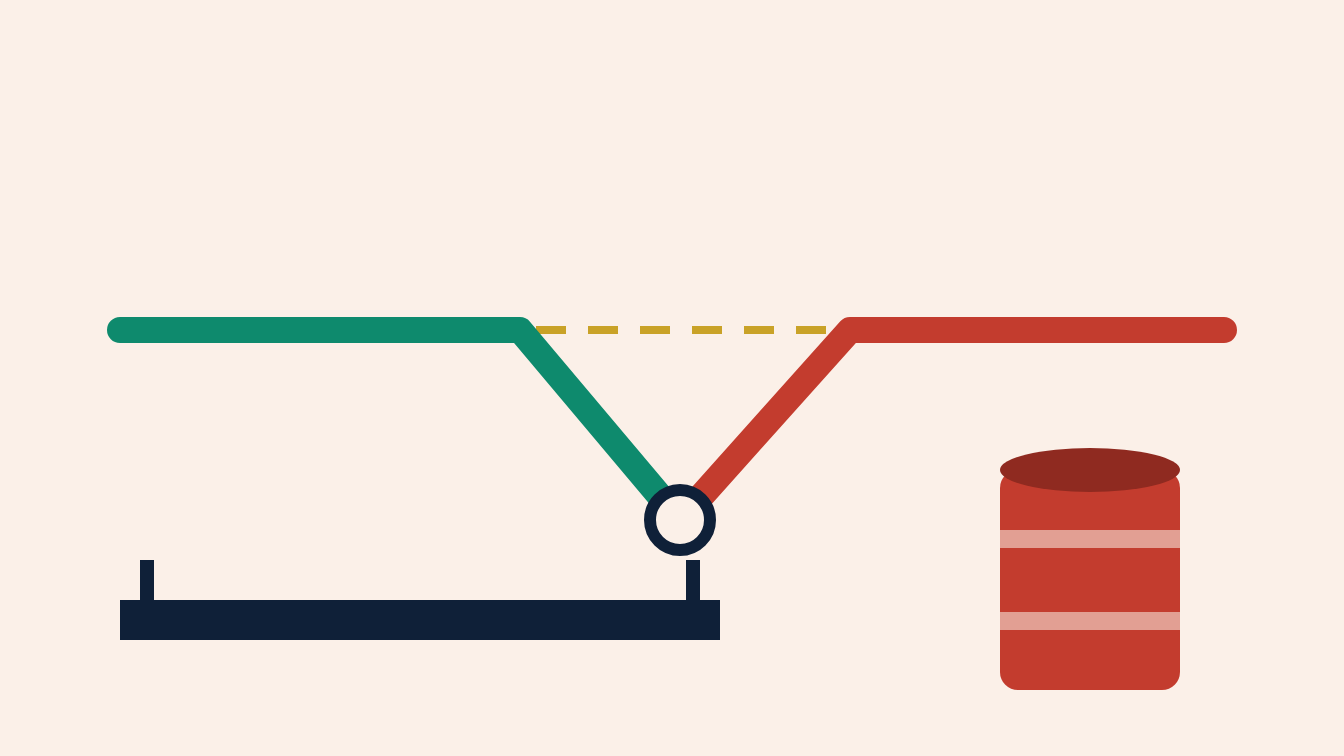
Why did a bigger promise produce a smaller effect? Because the buyback treats a symptom — too few buyers for old long bonds — and Thursday brought fresh news about the cause. Brent crude topped $93 a barrel, and WTI rose 2.7% to about $86.70, after President Trump threatened new economic measures against Iran and "tremendous economic consequences" for countries that help it. Oil is the most visible input to inflation, inflation is what the Fed's minutes worried about on Wednesday, and inflation worry is what pushes long-term yields up in the first place. A $4 billion buyer cannot outbid a $93 barrel.
The morning's data were, if anything, too good for the bond market. Initial jobless claims fell to 206,000, below the 210,000 expected — fewer layoffs, a labor market with no visible cracks. A Philadelphia-area factory survey jumped far above forecasts. Strong data plus high oil is the combination that gives the Fed cover to raise rates, not cut them. Stocks read it that way and sold: worst day in three weeks, all four boards down.
The register that rang wrong
Then there was Walmart. Yesterday's letter reported the numbers: US comparable sales grew 2.6%, a slowdown, while earnings beat and guidance rose. The stock market's verdict arrived Thursday — shares closed down 9.15% at $103.59, having traded as low as $102.85, the biggest one-day drop since May 2022. Wall Street had expected comparable sales of roughly 3.5–3.8%, so 2.6% was a miss, the company's first on that measure in years. The detail that stung: store traffic growth slowed to 1.5% from 3% in the prior quarter, and Walmart now expects about $2 billion more in fuel costs than it had budgeted. The chief financial officer's line explains the week: "when fuel prices increase and get above $4, perhaps there's a psychological impact to that … consumers are making trade-offs."
Here is the reading skill. Walmart's results were not bad — sales grew, profit beat, the full-year outlook went up. What fell 9% was the story: the idea that America's largest register is immune to $4 gasoline. Stocks are priced on expectations; a company can do well and still disappoint. When you see a big move on a decent report, look for the number that broke an assumption, not the numbers that were fine.
⭐ Spotlight: Brent crude — about $94 a barrel
Brent is the price of a barrel of North Sea oil, and it is the benchmark most of the world's crude is priced against (WTI, the US grade, usually trades a few dollars lower — about $87 this morning). Watchers track it because oil is the input that reaches everything fastest: fuel, freight, plastics, food. When Brent rises, inflation expectations rise, and long-term bond yields tend to follow — which is exactly the chain that undid the Treasury's relief on Thursday. When you see yields and oil move together, you are usually looking at one story, not two.
📈 Chart of the Day — a bad week inside a good year
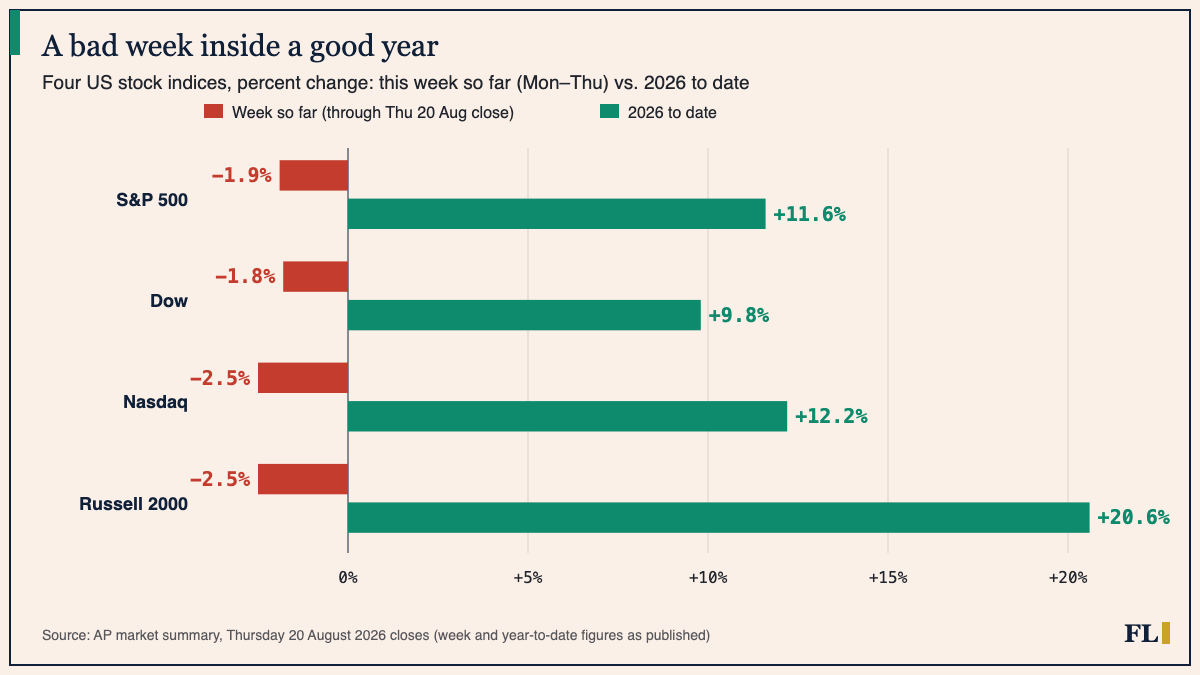
How to read this: every index has two bars on the same scale — this week's loss in brick, the year's gain in teal — so your eye measures one against the other. The week's red is real, but the longest teal bar belongs to the Russell 2000, the same board that fell most this week. The habit: before deciding whether a red week is a turn or a dip, put it next to the year. Numbers only mean something next to other numbers.
📅 Tomorrow
Today at 9:45 a.m. ET come the flash August PMIs — the first read of this month's business activity, with the composite expected near 53.2 after July's 54.5 (above 50 means growth). A strong print would feed the "no cuts" reading; a weak one would be the first crack in the data. The week after is quieter until the Jackson Hole symposium, 27–29 August.
We explain; we never advise. Nothing here is investment advice.
Financial Literature is for educational and informational purposes only. Nothing here is investment, financial, legal, or tax advice, or a recommendation to buy or sell any security. Content is impersonal and not tailored to any individual. Data may contain errors — verify before relying on it. Sources: AP (Thursday closes, via Yakima Herald); Investing.com historical (S&P 500); Yahoo Finance live blog (20 Aug); Federal Reserve H.15; Trading Economics (10-year, 30-year, DXY, USD/CAD, USD/MXN, crude, calendar); Motley Fool (Walmart close); Reuters via The Spokesman-Review (Walmart); Finance Calendar (Jackson Hole).
— The Editorial Team