🌎 AI shares slid into Fed week, and the VIX put a size on a normal day
An AI slowdown call from the labs themselves, Brent past $109 and a Fed expected to raise on Wednesday, plus the options market's price for a normal day.


Compiled Monday, 14 September 2026, about 10:15 a.m. in New York (Eastern Time), 45 minutes after the opening bell. A 4-min read. Every row below is a Monday-morning snapshot, still trading as this was written; Friday's final close sits in each note.
Yesterday's answer (Saturday's question): B. The chart showed changes, not levels, and the ten-year still yielded more than the two-year, 4.96% against 4.63%, so nothing had inverted. A move concentrated at the short end is a changed view of the next few Fed meetings, not of inflation across a decade.
Wall Street opened lower on Monday after the heads of two of the biggest AI labs said their own industry should slow down, and chipmakers took the largest share of the fall. In an essay posted on Saturday, Anthropic's chief executive, Dario Amodei, wrote that "we must slow the pace at which we improve the capabilities of AI models", and OpenAI's Sam Altman backed the call. In the first minutes of trading Micron and Marvell were down about 6% and Nvidia about 3%. Oil added its own weight: Brent passed $109 with Saudi Arabia's East-West pipeline shut since Friday after attacks. The Federal Reserve opens a two-day meeting tomorrow, and a quarter-point rise on Wednesday would be its first increase since July 2023.
📊 The Dashboard
| Gauge | Level | Move | What this means |
|---|---|---|---|
| S&P 500 (500 big US firms) | 7,619 | 🔴 ▼ −0.49% | Still trading. Friday's close was 7,656.98. So far inside the move the VIX priced for today (Spotlight). |
| Nasdaq Composite (tech-heavy) | 26,132 | 🔴 ▼ −0.76% | Still trading, from 26,333.04. The board with the most chipmakers fell the most. |
| Dow (30 blue-chip firms) | 52,475 | 🔴 ▼ −0.19% | Still trading, from 52,573.29. Fewer technology names, a smaller fall. |
| Russell 2000 (2,000 smaller firms) | 2,900 | ⚪ ▼ −0.15% | Still trading, from 2,903.94. The smallest fall of the four boards so far. |
| US 10-year Treasury yield | 5.00% | 🔴 ▲ +3 bp | Snapshot, from 4.975% on Friday's quote. Red because a higher yield means a lower price for bonds already issued. |
| Dollar index (DXY) | 99.71 | ⚪ ▲ +0.6% | Snapshot, from 99.12. The dollar rose as shares fell. |
| USD/CAD | 1.3918 | ⚪ ▲ loonie softer | Snapshot, from 1.3872. Canada's consumer prices rose 3.0% in the year to August, the same as July, published at 8:30 this morning. |
| USD/MXN | 17.15 | 🔴 ▲ peso weaker, 1.1% | Snapshot, from 16.97. The largest currency move on the board. |
| Brent crude | $109.23 | 🔴 ▲ +4.4% | Still trading, from Friday's $104.61, with a high of $109.74 so far. Red because America buys more crude than it sells abroad. |
What happened, in plain words
An index falls by what it holds. The companies that sell chips and computing power to AI builders have been priced on the pace of that building, so a call from the builders themselves to slow down reaches them first, and the Nasdaq, which holds more of them, fell more than the Dow or the Russell. Oil pulls on the same boards from a different side. A dearer barrel lifts the inflation the Fed is trying to bring down, which is how the ten-year yield touched 5% on a morning when shares fell, and why the dollar gained on the peso and the Canadian dollar. Two stories, one direction, two days before a rate decision.
⭐ Spotlight: the VIX, 17.29 this morning
The VIX is Cboe's index of how much movement buyers of S&P 500 options are paying for. It is designed to measure "the market's expectation of 30-day forward looking volatility", and it is quoted as a yearly rate, which makes the raw number hard to feel. So readers translate it: Cboe's own example is that a VIX of 16 means an expected 16% annual move, "which would equal a daily range of +/- ~1%", because 16 is roughly the square root of the number of trading days in a year.
Friday's close of 15.84 therefore priced Monday's S&P 500 move at about ±0.99%. This morning's 17.29 would price tomorrow's at about ±1.08% if it holds. People track it because it turns a mood into a size: it says what a normal day looks like before the day happens. The daily history back to 1990 is free, with the recipe for pulling it on Cboe on the Data Catalog.
📈 Chart of the Day: the band and the bar
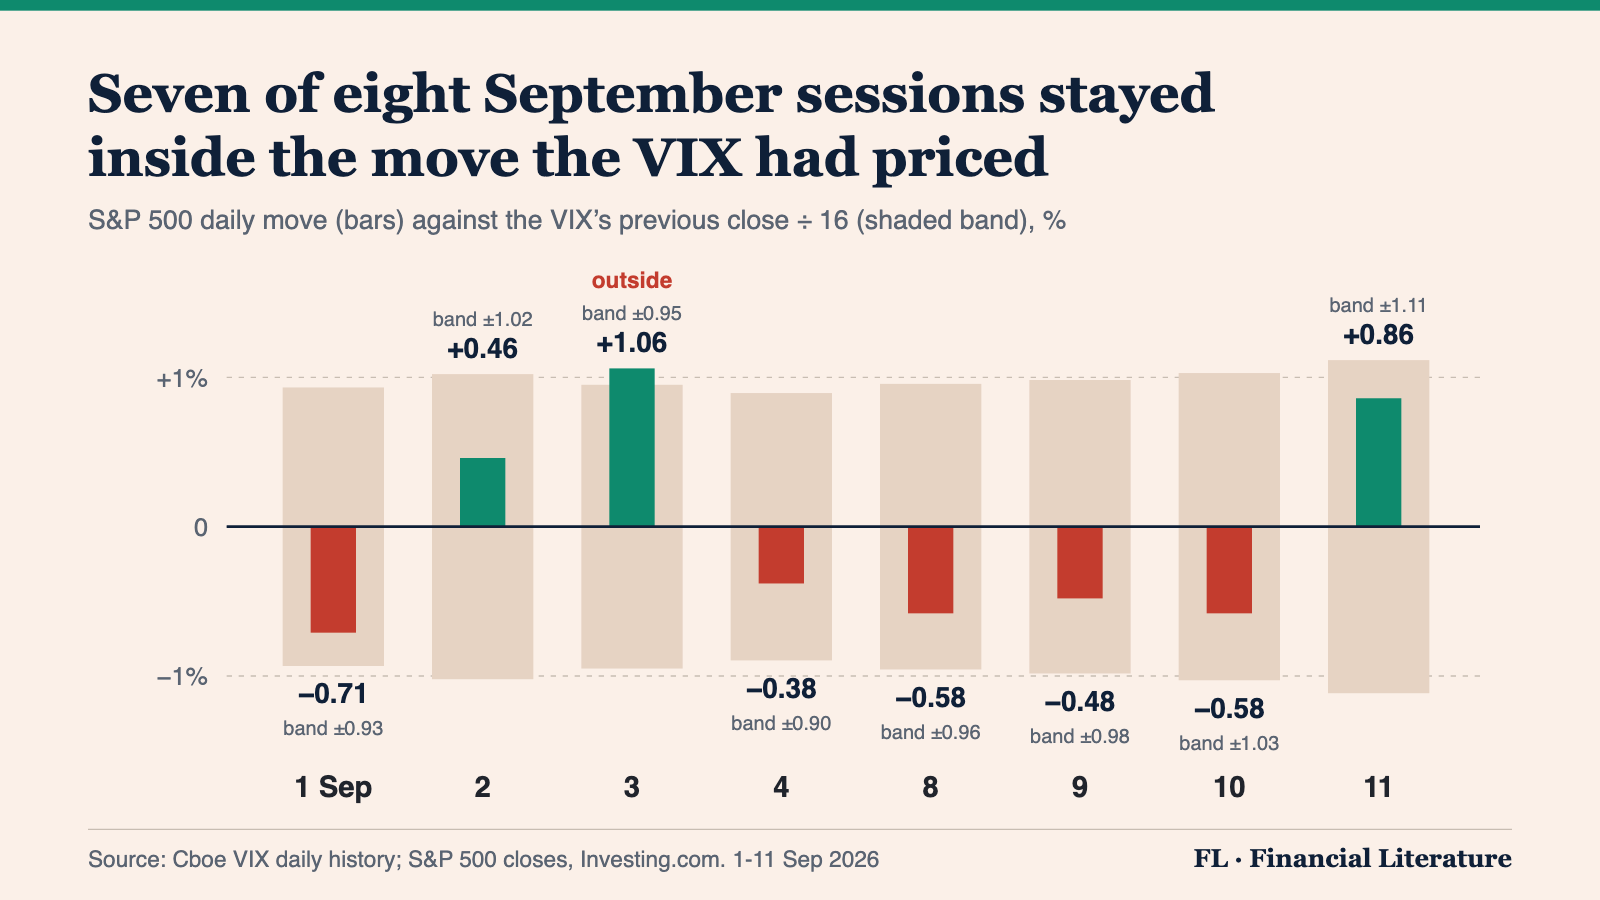
How to read this. Read the band before the bar. A move is only large or small against what was priced for it, and the shaded band is that price: the VIX's previous close divided by 16. The VIX describes one standard deviation, so roughly two sessions in three should land inside the band and one in three outside. Here seven of eight stayed in, and the one that broke out, 3 September, was a rise. The band is two-sided and says nothing about direction. A calm stretch like this one is a reading, not a promise: the band widens the moment the VIX does, which is what it did this morning.
📅 Tomorrow
Tuesday at 8:30 a.m. Eastern, the New York Fed's Empire State survey gives the first factory reading for September, and the Treasury reopens $13bn of 20-year bonds at 1 p.m., per its auction announcements. The Fed's meeting opens the same day; the decision comes Wednesday afternoon with a fresh Summary of Economic Projections, per the FOMC calendar, and August retail sales land that morning. Watch the VIX into Wednesday: a wider band before a decision is the options market pricing the announcement itself. Saturday's letter showed where last week's repricing landed on the Treasury curve.
One question. Today's chart showed each S&P 500 move against a band equal to the VIX's previous close divided by 16. If the VIX closes at 24 tonight, which reading is right? A: the S&P 500 will fall 1.5% tomorrow. B: options are pricing a typical one-day move of about 1.5% in either direction, with roughly two days in three expected to land inside it. C: the S&P 500 cannot move more than 1.5% tomorrow.
Forwarded this by a friend? Subscribe here. Found it useful? Forward it to one person who'd want it.
We explain; we never advise. Nothing here is investment advice.
Financial Literature is for educational and informational purposes only. Nothing here is investment, financial, legal, or tax advice, or a recommendation to buy or sell any security. Content is impersonal and not tailored to any individual. Data may contain errors, so verify before relying on it. Sources: Cboe VIX daily history; Federal Reserve open market operations; Statistics Canada; TreasuryDirect; Google Finance; Investing.com; Yahoo Finance; NBC News.
— The Editorial Team