🌎 50% — the US–Canada trade war arrived over the weekend
Trump's 50% tariffs on about $20 billion of Canadian goods took effect Saturday; Ottawa matches on 8 September. Plus a booming PMI and bitcoin's 22% week.

Compiled Monday, 24 August 2026, about 5:00 a.m. in New York (Eastern Time), before the opening bell. Stock index rows are final Friday closes, cross-checked against two settled sources; bond yields, currencies and oil trade around the clock, so those rows are Monday-morning snapshots and labeled as such.
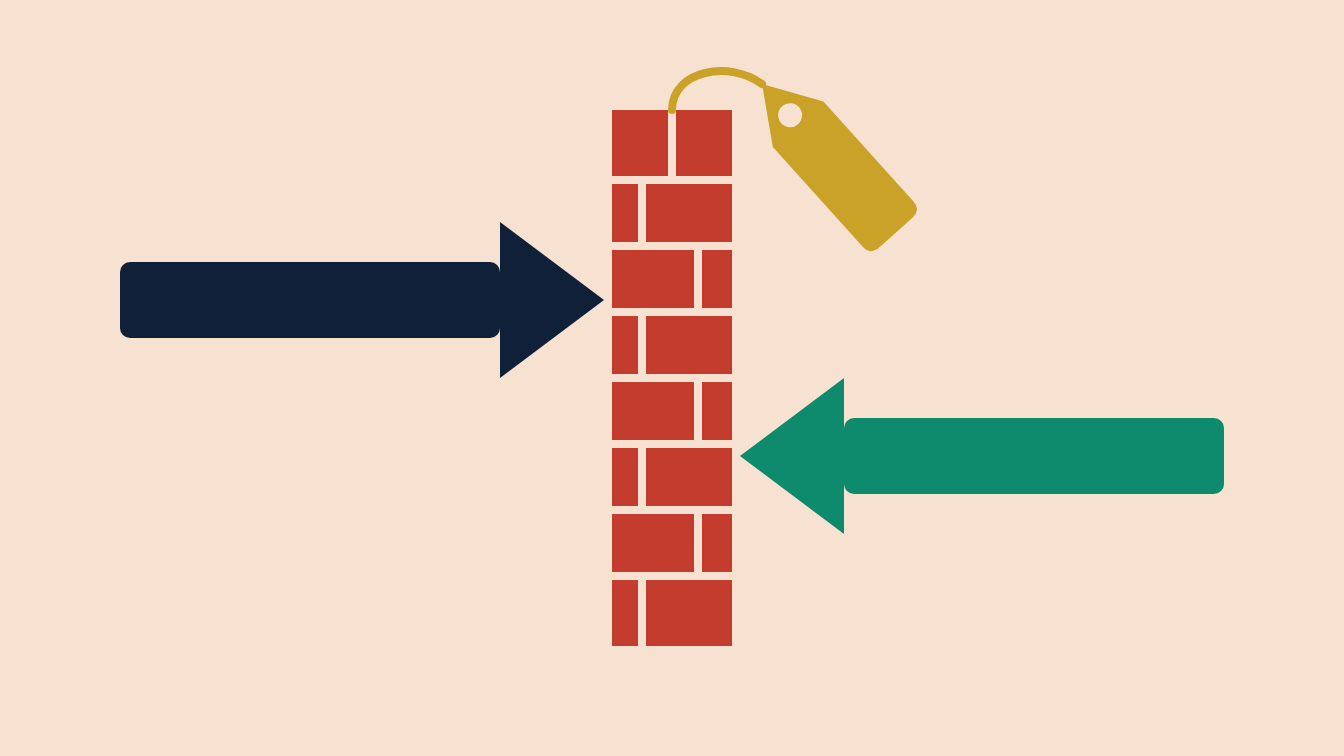
The US–Canada trade war stopped being a threat over the weekend: talks collapsed at a midnight deadline, 50% tariffs on about $20 billion of Canadian goods took effect Saturday, and Ottawa answers with its own on 8 September.
📊 The Dashboard — Friday, 21 August 2026 (closes)
| Gauge | Level | Move | What this means |
|---|---|---|---|
| S&P 500 (500 big US firms) | 7,674.37 | 🟢 ▲ +0.4% | Final. Up 33.21 points; Investing.com's settled row agrees to the cent (+0.43%). Friday's bounce still left the week down 1.4% — one green day does not repay four red ones. |
| Nasdaq Composite (tech-heavy) | 26,180.45 | 🟢 ▲ +0.4% | Final. Up 113.29 points — yet the week's worst board at −2.1%, with the AI trade holding its breath for Nvidia's results Wednesday. |
| Dow (30 blue-chip firms) | 53,277.01 | 🟢 ▲ +1.0% | Final. Up 517.80 points, Friday's best board — Yahoo's wrap agrees on the 1%. The Dow also lost least on the week (−0.8%): a defensive week, not a panicked one. |
| Russell 2000 (2,000 smaller firms) | 3,017.87 | 🟢 ▲ +0.9% | Rotation row, final. Up 25.44 points, and still 2026's best board at +21.6% for the year even after a −1.6% week. Small firms fall harder and bounce harder. |
| US 10-year Treasury yield | ≈4.71% | ⚪ ▼ easing | Monday snapshot. Reached 4.73% Friday, then slipped to about 4.71% Monday as attention turned to Jackson Hole; the 30-year sits near 5.25%, below last Monday's 5.31% milestone. |
| Dollar index (DXY) | ≈99.0 | ⚪ ▲ ≈+0.2% | Monday snapshot. Back at the 99 line after last week's slide — a slightly firmer dollar at the start of a week where the Fed does the talking. |
| USD/CAD | ≈1.384 | 🟢 ▲ ≈+0.6% | Monday snapshot. The pair jumped as the tariffs took effect, retreating from a three-month high for the loonie. A green arrow here means a falling Canadian dollar — every FX pair has two sides; know which one you are reading. |
| USD/MXN | ≈16.94 | ⚪ ≈ flat | Monday snapshot. Up about 0.1% — the peso keeps its quiet strong month (about +3%), helped by Mexico's 6.50% policy rate against the Fed's 3.50–3.75%. Money earns more waiting in pesos. |
What happened, in plain words
Friday was a relief day with a puzzle inside it. The morning's flash PMI — the month's earliest broad business survey — came in at 56.0, up from July's 54.5, where economists expected a cooling to about 53.2. That is the strongest reading in over four years, and the survey compiler now sees third-quarter growth "approaching 3.0%, up solidly from the 1.5% pace seen in the second quarter." A booming economy usually reads as bad news for bonds — more growth, more inflation risk, less reason to cut rates — and yields duly rose, the 10-year touching 4.73% and the 30-year 5.27%. By last week's script, stocks should have fallen. Instead all four boards closed green.
Here is the reading skill: after four red days, a market can rise simply because the selling is spent — the people who wanted out are out. A bounce that arrives despite unhelpful data tells you about positioning, not conviction. That is why Friday's green did not stop the week from finishing red on every board.
The loudest corner of the week was not on the stock boards at all. Bitcoin rose about 22% on the week to above $77,000 — its best week in years. The mechanics are worth learning: on 19 August about $1.44 billion of bets against bitcoin were forcibly closed, and the next day another $2.7 billion — a trader who bet on falling prices must buy to close a losing bet, so a rising price manufactures its own buyers. Add steady ETF inflows and a Treasury buyback plan that lifted appetite for risk generally, and you get a 22% week. When you see a move that size, ask who had to buy — forced buying and enthusiastic buying look identical on a chart.
The weekend the talks collapsed
At midnight Saturday the US imposed 50% duties on roughly $20 billion of Canadian goods after trade talks fell apart — Ottawa had refused a demand to restrict its ability to strike its own trade deals, which Prime Minister Mark Carney called "a question of sovereignty." His summary was blunter: "America is trying to break us so that they can own us." President Trump's reply, on Truth Social: "Canada wants the benefits of being a State, without being one!!!" Canada will match the tariffs dollar for dollar from 8 September.
Two mechanics to hold onto. First, a tariff is a tax collected at the border from the importer — its first effect is on the buying country's own prices. Second, exposure is asymmetric: nearly three-quarters of Canadian exports go to the United States, whose economy is roughly ten times larger — which is why the loonie, not the dollar, moved on the news. The currency market graded the weekend within hours: USD/CAD up about 0.6%.
The other weekend thread: Treasury Secretary Scott Bessent said Washington will detail what he called the "toughest" sanctions in history against Iran. Oil traders had already bid Brent up about 5% this month on that standoff, and Monday morning Brent eased 1.6% to near $93 — selling the news after a strong run. Oil sitting at $93 rather than falling toward $80 is one reason long-term yields have stayed high all month.
⭐ Spotlight: the flash PMI — 56.0
The PMI (Purchasing Managers' Index) is a monthly survey that asks the people who buy supplies for companies one simple question about each part of their business: better, worse, or the same as last month? Readings above 50 mean more firms improved than deteriorated — Friday's 56.0 measures breadth, not speed, and the "flash" version is an early estimate from most of the responses, refined two weeks later. Watchers track it because it is the first broad economic reading of each month, weeks ahead of official data — which is why one survey on a quiet Friday could move the odds on what the Fed does in September.
📈 Chart of the Day — one week, two markets
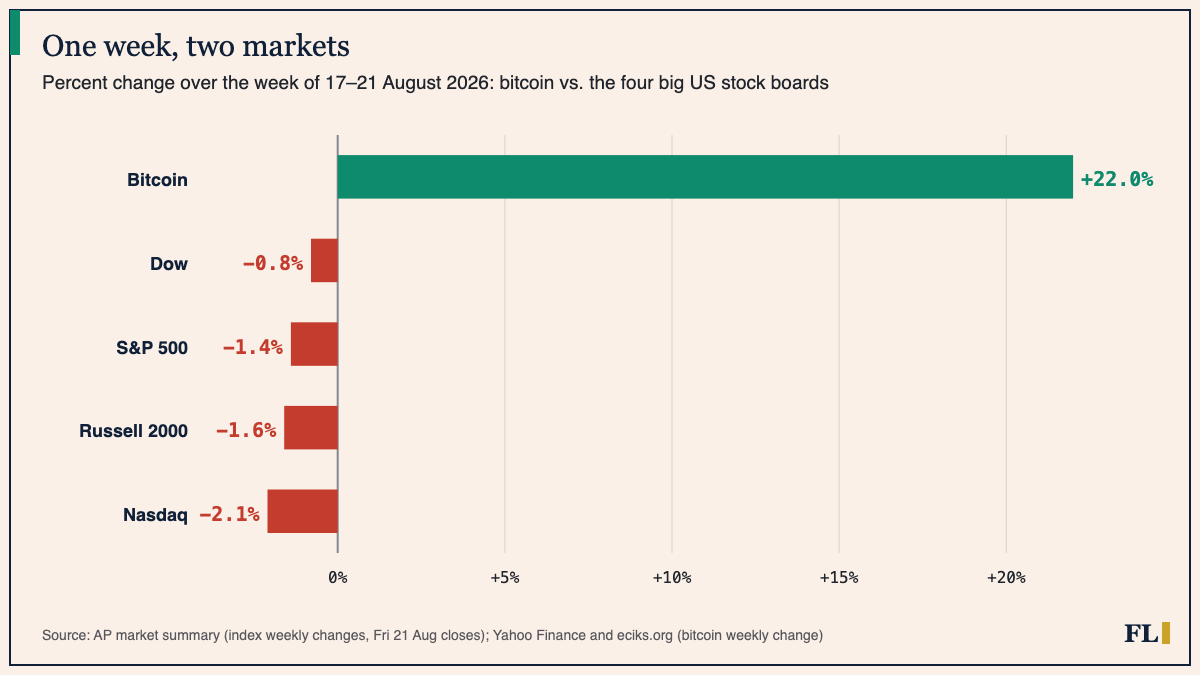
How to read this: all five bars share one axis, and one bar makes the others look like rounding errors. That is the point: bitcoin's weekly range is a different unit of risk from a stock index's — a 2% index week counts as heavy; a 22% bitcoin week has happened many times. The habit: before reacting to any bar chart, read the axis first. Cropped to the four brick bars alone, this chart would look dramatic; on the shared scale, it looks like what it is.
📅 Tomorrow
Tuesday is light — a weekly jobs reading, June house prices, and a regional factory survey. The week stacks everything on Wednesday: July PCE (the Fed's preferred inflation gauge), the second estimate of Q2 GDP, durable goods orders — and Nvidia's results after the close. Then Jackson Hole opens Thursday, and Fed Chair Kevin Warsh gives his first keynote Friday around 10 a.m. ET, nineteen days before the 16 September rate decision, with markets pricing roughly one-in-three odds of a September hike.
We explain; we never advise. Nothing here is investment advice.
Financial Literature is for educational and informational purposes only. Nothing here is investment, financial, legal, or tax advice, or a recommendation to buy or sell any security. Content is impersonal and not tailored to any individual. Data may contain errors — verify before relying on it. Sources: AP (Friday closes, via The Globe and Mail); Investing.com historical (S&P 500); Yahoo Finance live blog (21 Aug); Newsquawk (flash PMI); PBS NewsHour / AP (US–Canada tariffs); eciks.org (bitcoin week); Trading Economics (10-year, DXY, USD/CAD, USD/MXN, Brent); Newsquawk weekly calendar; Regards of Wall Street (Jackson Hole).
— The Editorial Team