🌎 WTI ≈+5% — Monday's real move wasn't in stocks
Wall Street slipped 0.1% while WTI crude jumped about 5% on the Hormuz standoff. When one market moves ten times the others, that's where the news landed.

Numbers compiled Tuesday, 11 August 2026, before the US open (about 4:30 am in New York, Eastern Time). Stock index rows are final Monday closes; currencies and bond yields trade around the clock, so those rows are live snapshots and labeled as such.
Wall Street spent Monday almost perfectly still while the oil market repriced a blocked strait — and the gap between those two sentences is today's whole lesson.
📊 The Dashboard — Monday, 10 August 2026 (closes)
| Gauge | Level | Move | What this means |
|---|---|---|---|
| S&P 500 (500 big US firms) | 7,753.11 | 🔴 ▼ −0.1% | Final. A pause four and a half points below Friday's record close — after the best week since April, flat is unremarkable. |
| Nasdaq Composite (tech-heavy) | 26,605.36 | 🔴 ▼ −0.3% | Final. Tech did the day's selling: Nvidia fell nearly 3% and Intel dropped on a plan to sell new shares. |
| Dow (30 blue-chip firms) | 53,975.98 | 🔴 ▼ −0.1% | Final. Essentially unchanged — a quiet day for the old-economy names. |
| Russell 2000 (2,000 smaller firms) | 3,017.40 | 🔴 ▼ −0.6% | Final. Rotation row this week: smaller companies fell hardest. They carry more debt, so days when rate worries rise tend to bite them first. |
| US 10-year Treasury yield | ≈4.73% | ⚪ rising | Live snapshot. Roughly 4.66% before the weekend, about 4.68% mid-Monday, near 4.73% at press time — the why is below. |
| Dollar index (DXY) | ≈99.8 | ⚪ ≈ flat | Live snapshot. Steady, holding just above Friday's slide toward its weakest since mid-June. |
| USD/CAD | ≈1.393 | ⚪ ≈ flat | Live snapshot. Canada exports oil, so dearer crude tends to support its dollar; so far it is merely steady. |
| USD/MXN | ≈17.12 | ⚪ ≈ flat | Live snapshot. The peso sat out the oil move entirely. |
Confirmed vs pending: all four index rows are final Monday closes from AP data. The yield and currency rows were still moving when we went to press — Tuesday's board lands in the next issue.
What happened, in plain words
The Strait of Hormuz — the narrow sea passage that carries roughly a fifth of the world's seaborne oil — has been closed to shipping since earlier this year, and on Monday the talks to reopen it got harder, with Iran listing six conditions, including sanctions relief, before traffic resumes. Traders read that as "less oil for longer": WTI crude, the US oil benchmark, climbed from just over $78 a barrel on Friday to about $82 by Monday's end — a jump of roughly 5% (our own arithmetic from those two prices) — and it kept rising into Tuesday, a fourth straight session of gains.
The stock market's response was a shrug: the S&P 500 gave back 0.1%, slipping just below the record it set Friday. But a flat index is not a flat market. Underneath, energy shares rose with crude while tech fell — Nvidia lost nearly 3% after reports it is working with Wall Street firms on a roughly $500 billion AI-infrastructure financing package, and Intel dropped after saying it may sell $15 billion of new shares (by Tuesday the sale had grown to $20 billion at $95 a share). The two sides roughly cancelled, and the index printed a number that looks like nothing happened.
The bond market did not shrug. Expensive oil eventually shows up in consumer prices, and inflation is the one thing that keeps a central bank from cutting rates — so the 10-year Treasury yield, the US government's benchmark borrowing rate, crept from about 4.66% toward 4.73%. That is Friday's machine running in reverse: a week ago, weak jobs data pushed yields down and stocks up; Monday, dearer oil pushed yields up and stocks stalled. Same machine, opposite direction.
⭐ Spotlight: WTI crude — about $82 a barrel
West Texas Intermediate is the benchmark price for US oil, set by futures contracts that deliver crude to Cushing, Oklahoma; its slightly pricier sibling, Brent (about $88 today), prices the oil that moves by sea for the rest of the world. People track WTI because it is the most direct early-warning gauge of US inflation that trades every day: what happens to crude this month reaches gasoline pumps and delivery surcharges over the following ones. When you see WTI move several percent in a day, the practical reading is not "oil got expensive" but "the market just changed its mind about future inflation" — which is why the bond market, not the stock market, reacted first on Monday.
📈 Chart of the Day
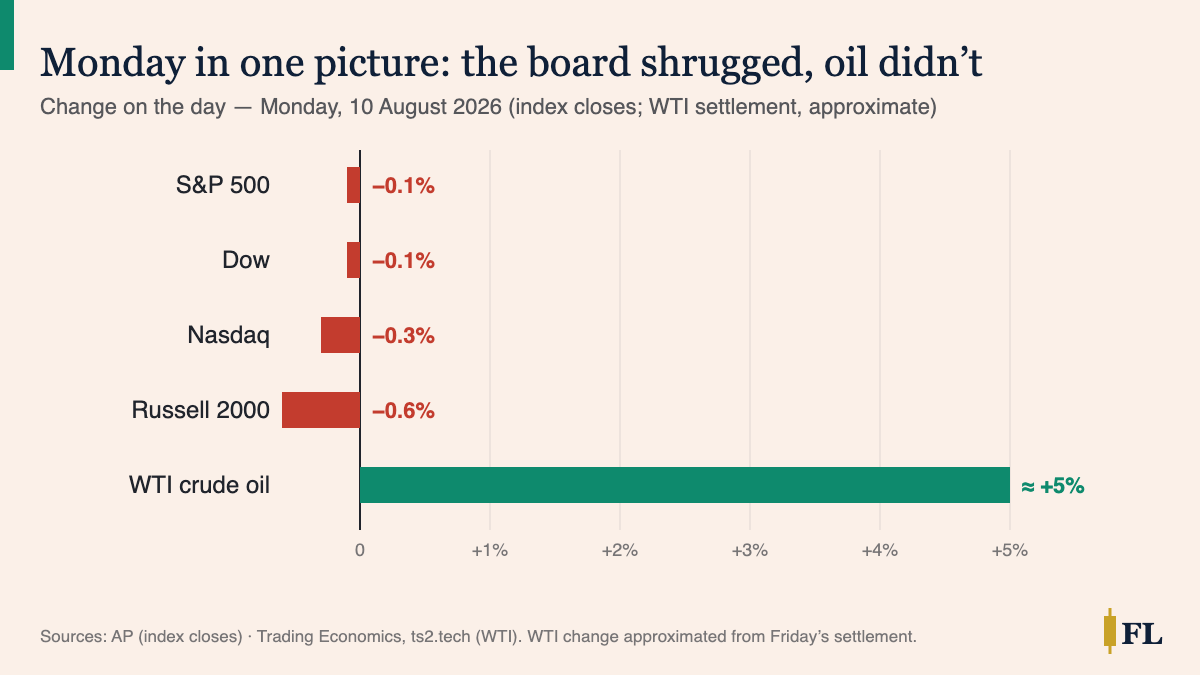
How to read this: when a day's numbers land, scan for the outlier before you read anything else — the bar that dwarfs the rest is where the news actually happened, whatever the headlines lead with. And remember that a near-zero bar can hide a real fight: Monday's flat S&P was energy rising and tech falling in roughly equal measure, not an absence of movement.
📅 Tomorrow
Tonight after the US close, two AI-infrastructure companies — CoreWeave and Super Micro — report earnings, a read on whether the build-out spending behind that $500 billion financing headline is still accelerating. Then Wednesday at 8:30 am ET comes the week's main event: the July inflation report (CPI), with forecasters expecting about +0.2% on the month and +0.3% core. Note the timing trap: Monday's oil jump is an August event — it cannot appear in July's data. Watch whether yields keep creeping toward the print; that tells you what the bond market expects before the number says a word.
We explain; we never advise. Nothing here is investment advice.
Financial Literature is for educational and informational purposes only. Nothing here is investment, financial, legal, or tax advice, or a recommendation to buy or sell any security. Content is impersonal and not tailored to any individual. Data may contain errors — verify before relying on it. Sources: AP index closes via The Epoch Times; Yahoo Finance (Nvidia, CPI); TS2 market wrap (WTI, Iran conditions, Intel); Trading Economics (crude, yields, FX snapshots); Investrade mid-morning look.
— The Editorial Team