🌎 CPI held at 3.4%, and the week's rate move landed at the short end
August consumer prices, Friday's rebound inside a losing week, and a Treasury curve that moved most where the Fed's next few meetings live.

American consumer prices rose 3.4% in the year to August, exactly as they had in July, and the week's largest move happened in the bond market rather than the stock market.
Compiled Saturday, 12 September 2026, at 11 in the morning in Seoul, which is 10 on Friday evening in New York (Eastern Time), a 4-min read. This is the week's close, written after Wall Street had shut, so every number below is final. The daily column is Friday's move; the week column runs close to close, Friday 4 September to Friday 11 September, and that week held four sessions rather than five, because Monday was Labor Day.
Yesterday's answer (Thursday's question, the last of the week): B. The shares of a gallon are weights, so a move in one component passes through in proportion to its weight, which makes a 10% rise in crude worth roughly 5% at the pump. Federal and state taxes are levied in cents per gallon, so they stay put in dollars while their share of a rising total falls.
The Bureau of Labor Statistics reported on Friday morning that the consumer price index rose 0.4% in August after 0.1% in July, and 3.4% over the twelve months, unchanged from July's reading. The index excluding food and energy rose 0.3% on the month and 2.4% over the year, a touch below July's 2.5%. The split between those two lines is the month's story: energy rose 2.1% in August alone and is 16.3% dearer than a year ago, with gasoline up 27.4% and fuel oil up 52.0%, while shelter and food both behaved.
Wall Street rose on the news and still finished the week lower. The S&P 500 gained 65.28 points on Friday to 7,656.98 and lost 61.62 points across the week; the Dow added 509.19 on the day and shed 840.96 on the week. The move that mattered was in Treasuries, where the two-year yield ended the week 26 basis points higher at 4.63% while the thirty-year rose 11 to 5.35%. The Federal Reserve decides on Wednesday.
📊 The Dashboard, week ending Friday, 11 September 2026
| Gauge | Friday's close | Friday | On the week | What this means |
|---|---|---|---|---|
| S&P 500 (500 big US firms) | 7,656.98 | 🟢 ▲ +0.9% | 🔴 ▼ -0.8% | Final: AP, Investing.com. One green session inside four. |
| Dow (30 blue-chip firms) | 52,573.29 | 🟢 ▲ +1.0% | 🔴 ▼ -1.6% | Final: AP. The weakest of the three large boards on the week. |
| Nasdaq Composite (tech-heavy) | 26,333.04 | 🟢 ▲ +1.0% | 🔴 ▼ -0.7% | Final: AP. The mildest weekly fall of the four. |
| Russell 2000 (2,000 smaller firms) | 2,903.94 | 🟢 ▲ +0.4% | 🔴 ▼ -2.4% | Final: AP. Smaller firms borrow more at short maturities, and those rates moved most. |
| US 2-year Treasury yield | 4.63% | 🔴 ▲ +7 bp | 🔴 ▲ +26 bp | US Treasury. The week's biggest move on the curve. |
| US 10-year Treasury yield | 4.96% | 🔴 ▲ +1 bp | 🔴 ▲ +18 bp | US Treasury. Red because a higher yield means a lower price for bonds already issued. |
| Dollar index (DXY) | 99.12 | ⚪ +0.1% | ⚪ little changed | Investing.com, from 99.18. Higher US rates did not move the dollar this week. |
| USD/CAD | 1.3872 | ⚪ loonie softer | ⚪ loonie softer | Investing.com, from 1.3840. Canada exports oil, and its currency still eased. |
| USD/MXN | 16.973 | ⚪ peso firmer | ⚪ peso softer | Investing.com, from 16.886 a week earlier. |
| Brent crude | $104.61 | 🟢 ▼ -2.8% | 🔴 ▲ +8.7% | Investing.com. It touched $109.97 in Friday's session. Green when it falls, because America buys more crude than it sells abroad. |
What happened, in plain words
An inflation rate that holds still can still change what people expect, because what sits underneath it changes. August's energy line was 16.3% above a year earlier and the barrel went on rising all week, so the arithmetic that keeps the headline at 3.4% next month looks harder than the arithmetic that kept it there last month. Lenders reacted where that matters most, which is in short-dated government debt, and shares of smaller companies, which borrow at those same short maturities, had the worst week of the four boards. The stock market's Friday bounce and its losing week are not in conflict; they are four sessions and one of them.
⭐ Spotlight: the gap between two-year and ten-year yields, 33 basis points
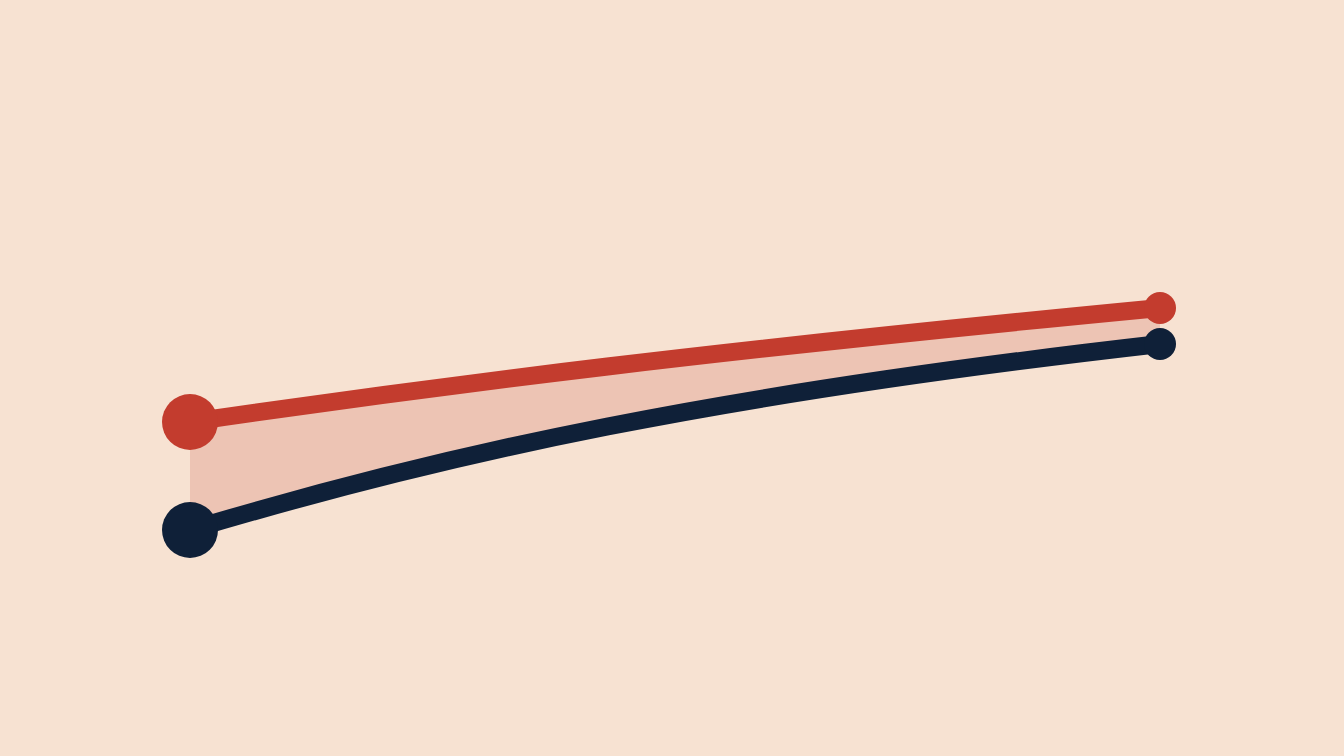
The two-year and ten-year Treasury yields are quoted side by side so often that the distance between them has a name of its own on a trading desk. It is one subtracted from the other: on Friday, 4.96% minus 4.63%, or 33 basis points, against 41 a week earlier. The two ends answer different questions, which is why the gap is worth watching. A two-year yield is mostly a view on where the Fed's policy rate will average over the next two years, so it moves on meetings and data; a ten-year yield adds a decade of expected inflation and a premium for lending that long. When the gap narrows without either end falling, the near-term view has simply moved further than the long one. Both series are published daily and carried in FRED on the Data Catalog.
📈 Chart of the Day: where the week's move landed
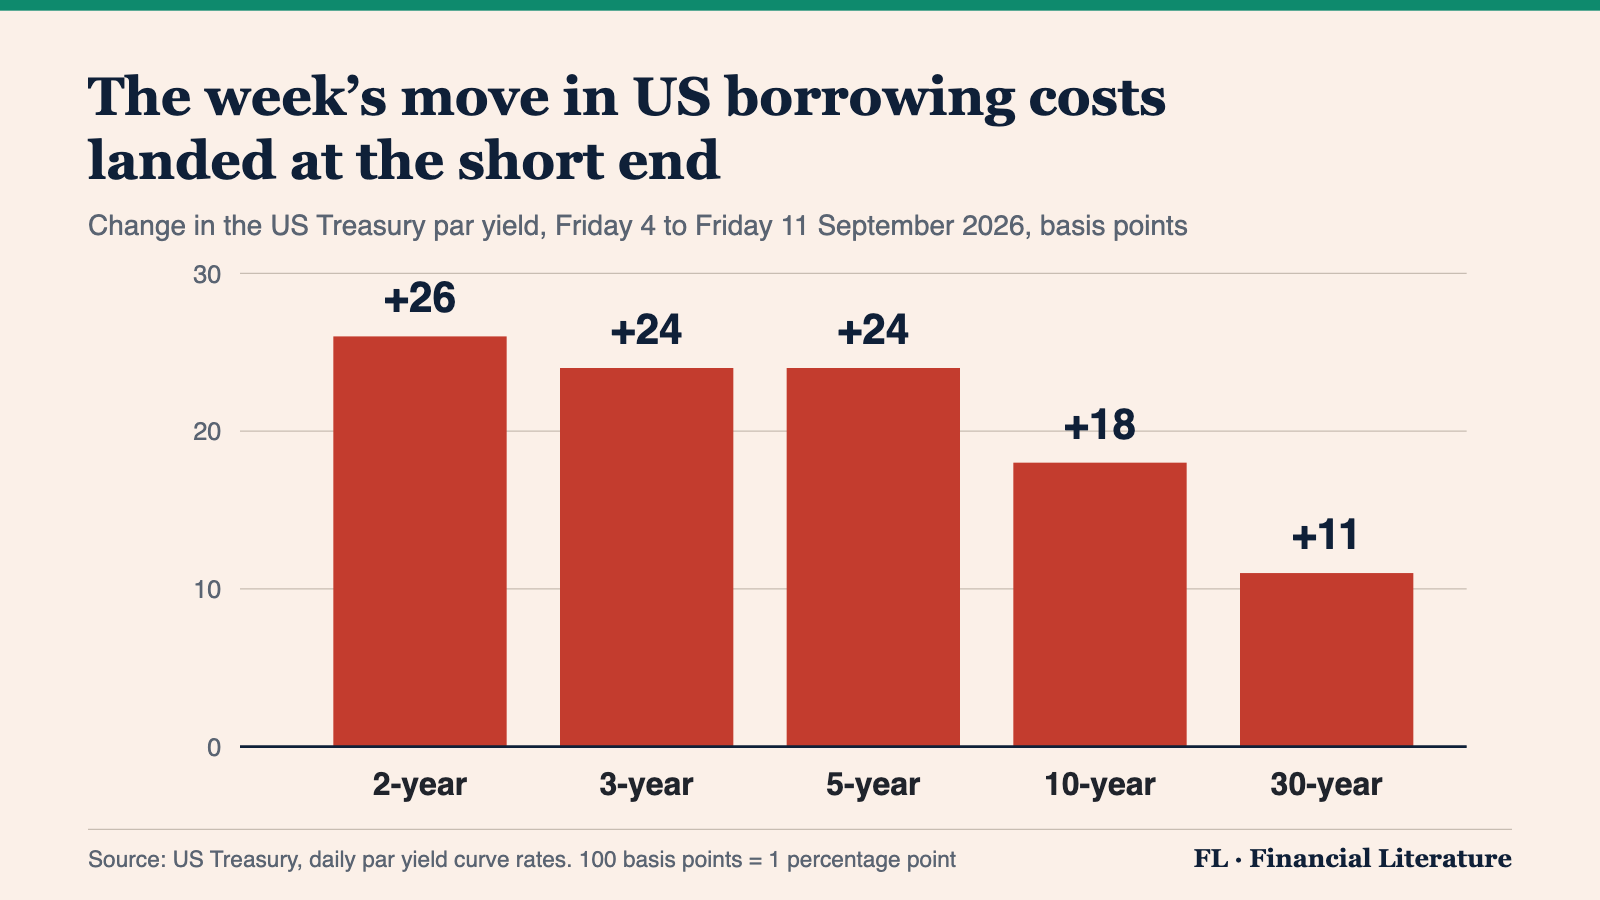
How to read this: a yield curve is a price of time, one number for each length of loan, so the reading that teaches you something is rarely the level. It is the shape, and how the shape changed. Read a chart like this left to right and ask where the move is concentrated. Weight at the short end says the market has changed its mind about the next year or two, the span a central bank most directly influences. Weight at the long end says something has shifted in expected inflation, or in what lenders demand for tying money up for decades. Here the bars descend, so this was a near-term argument.
📅 Monday, and the week
The Federal Open Market Committee meets Tuesday and Wednesday and announces on Wednesday afternoon, with a Summary of Economic Projections, the quarterly document in which each participant marks where they think the policy rate belongs. The target range has stood at 3.50% to 3.75% since 11 December 2025, so this is the first meeting of the autumn with fresh projections attached. Friday's report was the last scheduled inflation reading before it. Tuesday's letter explained why the Fed's 2% goal is written on one gauge and not on the consumer price index; Thursday's traced how much of an oil move reaches the pump.
One question. Today's chart showed the two-year Treasury yield up 26 basis points across the week and the thirty-year up 11. Which reading is right? A: Short-term borrowing now costs more than long-term borrowing. B: The market repriced the next year or two more than the next three decades, which is the part a central bank most directly influences. C: The thirty-year is the more reliable of the two, because it moved less.
Financial Literature is for educational and informational purposes only. Nothing here is investment, financial, legal, or tax advice, or a recommendation to buy or sell any security. Content is impersonal and not tailored to any individual. Data may contain errors, verify before relying on it. We explain; we never advise. Sources: US Bureau of Labor Statistics, US Treasury, Federal Reserve, Associated Press via WTOP, Investing.com, Trading Economics.
Forwarded this by a friend? Subscribe here. Found it useful? Forward it to one person who'd want it.
— The Editorial Team