🌎 Brent $101 — Wall Street's third red day, and how much of it reaches the pump
Brent closed at $101.21 on Wednesday, back above $100 for the first time since July. Crude is about half the price of a gallon, so the pump moves less.

Compiled Thursday, 10 September 2026, about 7:15 a.m. in New York (Eastern Time), before the opening bell. A 4-min read. The four index rows and both yields are Wednesday's closes. Currencies and oil trade around the clock, so those rows are Thursday-morning snapshots, still moving as this was written.
Yesterday's answer: B — the cover ratio counts dollars bid against dollars offered, so it says nothing about price. What the notes cost is the stop yield, 4.474%. Primary dealers must bid at every sale, so the smaller their allotment, the more of the paper everyone else took.
Brent crude closed at $101.21 on Wednesday, up 3.4% on the day and back above $100 for the first time since July, after strikes between the United States and Iran put the flow of oil through the Strait of Hormuz in question. All four American boards fell for a third session running. The S&P 500 ended within five points of where it began September.
📊 The Dashboard
| Gauge | Level | Move | What this means |
|---|---|---|---|
| S&P 500 (500 big US firms) | 7,636.36 | 🔴 ▼ −0.48% | Wednesday's close, a third fall in a row, and within five points of the 1 September close. |
| Nasdaq Composite (tech-heavy) | 26,253.34 | 🔴 ▼ −0.64% | Wednesday's close. The tech board fell by more than the S&P, the reverse of Tuesday. |
| Dow (30 blue-chip firms) | 52,380.66 | 🔴 ▼ −0.77% | Wednesday's close, 405 points lower. |
| Russell 2000 (2,000 smaller firms) | ≈2,922 | 🔴 ▼ about −1.3% | Wednesday's close, the largest fall of the four. Smaller firms carry more floating-rate debt than big ones, so rising yields reach them faster. |
| US 10-year Treasury yield | 4.83% | ⚪ ▲ +3 bp | Wednesday's close, from 4.80% on Tuesday, near the top of its range this year. |
| US 2-year Treasury yield | 4.43% | ⚪ ▲ +4 bp | Wednesday's close, from 4.39%. The two-year tracks what traders expect the Fed to do next. |
| Dollar index (DXY) | 98.89 | ⚪ ▲ +0.1% | Thursday morning, a shade above Wednesday's 98.81. |
| USD/CAD | 1.3819 | ⚪ ▲ loonie softer | Thursday morning, from 1.3805. Canada exports oil, and its currency has still not followed this week's barrel. |
| USD/MXN | 16.92 | ⚪ ▲ peso softer | Thursday morning, from 16.89, still near the strong end of its range for the past year. |
| Brent crude | $102.10 | ⚪ ▲ +0.9% | Still trading. Wednesday's close was $101.21, up 3.4%. |
What happened, in plain words
The trigger was not a company or a data release. American forces and Iran traded strikes this week, and what markets are pricing is the shipping lane that carries much of the world's seaborne oil, the Strait of Hormuz. Brent has added more this morning, reaching its highest in over three months. Higher energy costs travel through an economy slowly and unevenly: they lift the cost of moving everything, they squeeze firms that cannot pass them on, and they push up the inflation figures a central bank reads. That last link is why a barrel moved a bond market this week: the 10-year yield rose to 4.83%, and interest-rate futures put the chance of a quarter-point rise at next week's Federal Reserve meeting at 60.1%, against 39.9% for holding at 3.50% to 3.75%.
We have watched this loop before: on 2 September a barrel passing $90 was already taking points off the boards. What has changed is how far down the chain it now reaches.
⭐ Spotlight: the pump price, $4.157 a gallon
Once a week the US Energy Information Administration surveys retail outlets and publishes two national averages, taxes included: one for regular gasoline, one for on-highway diesel. It is the plainest number in the energy complex, because it is the one a household hands over, and it feeds the energy part of Friday's consumer price index.
For the week to 7 September, regular gasoline averaged $4.157 a gallon, up 8.6 cents on the week and 96.5 cents on the year. Diesel is the one to watch. It averaged $5.967, up 36.8 cents in a single week and $2.20 above a year ago. Diesel comes out of the same barrel, but it goes into trucks, trains, ships and furnaces rather than cars, and American stocks of it were 14% below the five-year average in the last weekly count, for the week to 28 August. One barrel, two products, two very different squeezes.
📈 Chart of the Day
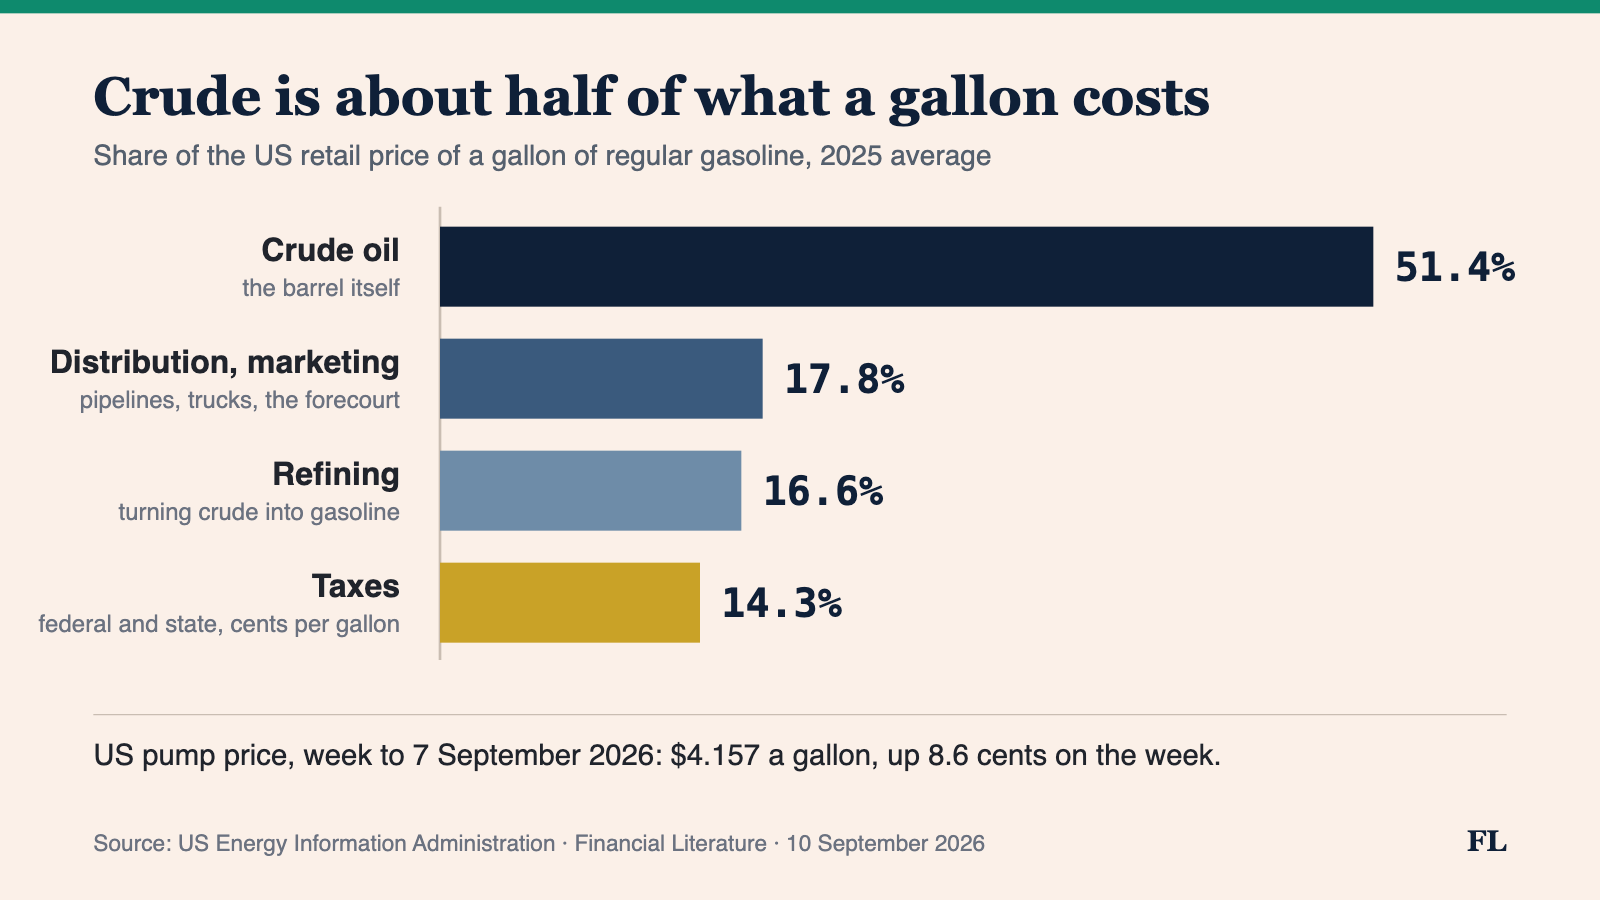
How to read this. When a barrel jumps, resist multiplying the pump price by the same percentage. Read the chart as a set of weights. Crude was 51.4% of the average American gallon last year, so a 10% move in crude is worth roughly 5% at the pump if nothing else changes. The other slices behave differently. Federal and state taxes are levied in cents per gallon, so they do not move when oil does, and their share shrinks as the price rises. Refining and distribution margins do move, on their own schedule, which is why a gallon can climb while crude sits still. And weights describe an average, not a rule: the shares are recomputed every year, and they shift the moment one link gets tight, which is what diesel is showing now. The weekly prices, stocks and refinery runs behind all of it are free, with the recipe for pulling them on our EIA on the Data Catalog page.
📅 Tomorrow
Producer prices for August land at 8:30 a.m. Eastern this morning, roughly an hour after this issue was written, and consumer prices follow at the same hour on Friday, per the BLS schedule. July's producer index ran 4.7% above a year earlier; one collector's consensus for August is 5.1%. The line worth finding is producer energy, which was 18.2% higher than a year before in July, when the barrel was still in the $90s. The weekly energy stock count, pushed back a day by Labor Day, arrives at noon, and the Treasury reopens $22bn of 30-year bonds at 1 p.m.
One question. Today's chart showed crude oil at 51.4% of the average US price of a gallon of gasoline last year, with federal and state taxes at 14.3%. Which reading is right? A: a 10% rise in crude lifts the pump price 10% as well. B: crude carries about half the weight, so a 10% move in crude is worth roughly 5% at the pump, and the tax slice does not move with it. C: taxes are the smallest slice, so they must rise whenever crude does.
Forwarded this by a friend? Subscribe here. Found it useful? Forward it to one person who'd want it.
We explain; we never advise. Nothing here is investment advice.
Financial Literature is for educational and informational purposes only. Nothing here is investment, financial, legal, or tax advice, or a recommendation to buy or sell any security. Content is impersonal and not tailored to any individual. Data may contain errors, so verify before relying on it. Sources: EIA weekly retail fuel prices; EIA gasoline price components; BLS release schedule; US Treasury daily par yields; Associated Press via WTOP; Investing.com; Trading Economics.
— The Editorial Team