🌎 54.6 — fewer factories grew in August; oil past $90 sank the boards
ISM’s factory gauge fell to 54.6 from 55.6, an eighth month above 50; Brent rose 4.6% on new US strikes on Iran and the S&P 500 fell 0.7%.


Compiled Wednesday, 2 September 2026, about 7:25 a.m. in New York (Eastern Time), before the opening bell. A 4-min read. Stock index rows are final Tuesday closes; yields and currencies trade around the clock, so those rows are Wednesday-morning snapshots and labeled as such.
Yesterday's answer: B — because a daily move and a monthly move are measured over different spans; the month ran close-to-close from 31 July to 31 August, so Monday’s fall was already inside August’s gain.
A second round of US strikes on Iran pushed Brent crude up 4.6% and US crude to its first close above $90 in more than a month, the 10-year Treasury yield closed at its highest since January 2025, and every board fell, the Nasdaq by 1%; at 10 a.m. the factory gauge said US manufacturing grew for an eighth straight month, only less widely, and that 50-line is today’s lesson.
📊 The Dashboard, Tuesday, 1 September 2026 (closes)
| Gauge | Level | Move | What this means |
|---|---|---|---|
| S&P 500 (500 big US firms) | 7,631.47 | 🔴 ▼ −0.71% | Final. Down 54.67 points (Investing.com); still +11.5% for the year. |
| Nasdaq Composite (tech-heavy) | 26,099.77 | 🔴 ▼ −1.03% | Final. Down 271.11 points (Investing.com), the weakest board: Amazon fell 1.9% and Nvidia 1.5%. +12.3% for the year. |
| Dow (30 blue-chip firms) | 52,766.88 | 🔴 ▼ −0.79% | Final. Down 419.02 points (Investing.com); +9.8% for the year. |
| Russell 2000 (2,000 smaller firms) | 2,920.13 | 🔴 ▼ −1.23% | Rotation row. Down 36.32 points (Investing.com), the day’s largest fall; still the year’s leader at +17.7%. |
| US 10-year Treasury yield | ≈4.80% | 🔴 ▲ 20-month high | Wednesday snapshot. Tuesday it closed at 4.796%, up about 4 basis points, its highest since January 2025; this morning 4.80%, with the 2-year at 4.40% and the 30-year at 5.28% (Investing.com). |
| Dollar index (DXY) | ≈99.8 | 🟢 ▲ +0.1% | Wednesday snapshot, the highest in nearly three weeks, from 99.64 at Tuesday’s close. |
| USD/CAD | ≈1.393 | 🔴 ▲ loonie weaker | Wednesday snapshot, from 1.3895. The Bank of Canada decides today at 9:45 a.m. ET; all 35 economists polled by Reuters expect a hold at 2.25%. |
| USD/MXN | ≈17.01 | 🔴 ▲ peso weaker | Wednesday snapshot, from 16.98. |
What happened, in plain words
US forces struck Iranian targets again and Iran fired back, so oil moved first: WTI closed at $90.22, up 5.2% and Brent at $94.65, up 4.6%, its highest since late July. Dearer oil means dearer inflation, which makes a Fed chair who put prices first last Friday likelier to raise rates on 16 September: yields rose, and Trading Economics’ count of the futures-implied odds of a September hike stood near 70% this morning, from about 62% at Monday’s close. Higher yields weigh most on companies whose profits sit furthest ahead, so technology led the fall. The morning’s data were steadier than the tape: July job openings came in at 7.27 million, a touch under the 7.30 million expected, and the ISM factory gauge slipped to 54.6. One oil fact to keep: 17 million barrels passed through the Strait of Hormuz on Monday, the most in a day since the war began; the price is moving on risk, not on a closed tap.
⭐ Spotlight: the ISM Manufacturing PMI, 54.6
Every month the Institute for Supply Management asks purchasing managers at US manufacturers whether new orders, production, employment, supplier deliveries and inventories are better, the same or worse than a month earlier. Each answer becomes a diffusion index, the share saying better plus half the share saying the same, and the PMI is the equal-weighted average of the five. That makes 50 the line where as many firms report growth as report decline, so August’s 54.6 says most factories still grew, not that output rose 4.6%; the one-point fall from 55.6 means a smaller majority reported growth, below the 55.2 forecast. Watchers track it because it lands weeks before official output data, and because its Prices index, 71.1 for a second month, is the earliest reading of factory-gate inflation: ISM blamed steel and aluminium, tariffs and petroleum-based inputs from the Middle East conflict. Two footnotes. Supplier deliveries is the one inverted component: slower deliveries push the PMI up (59.3 in August, a strained-supply signal, not a demand one). And ISM says a PMI held above 47.5 over time fits a growing economy, so it counts the economy’s expansion at 22 months and manufacturing’s at eight, after ten months below 50. In August, new orders fell three points to 53.7, employment eased to 51.2 and production held at 58.3.
📈 Chart of the Day, the 50-line
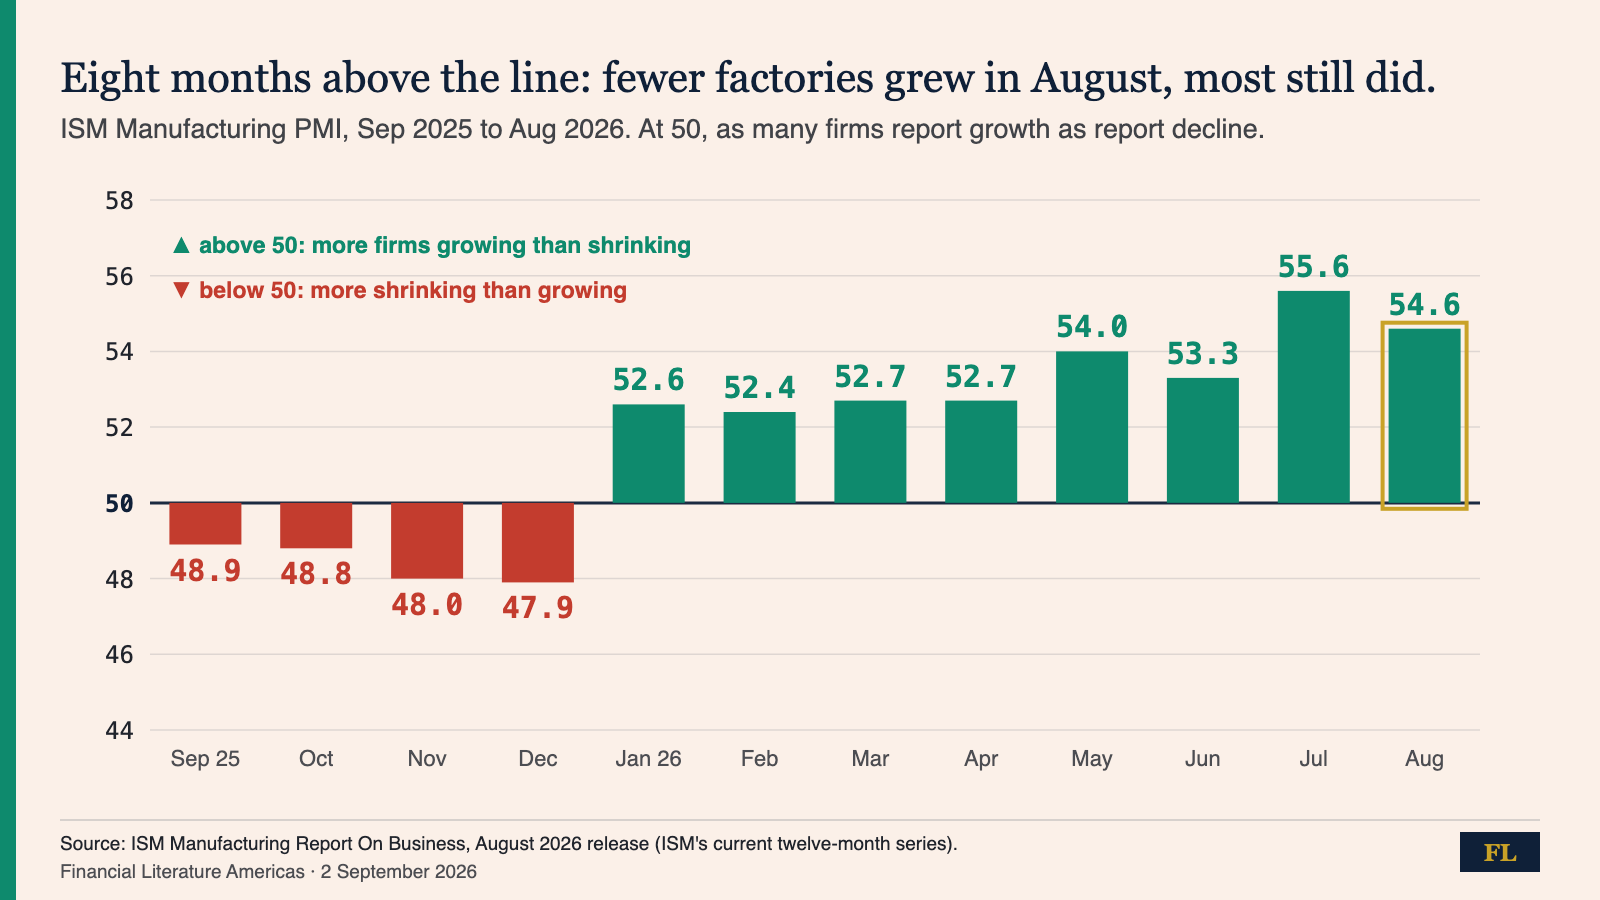
How to read this: find the line before the bars. On a diffusion index the neutral level is 50, not zero, so a bar’s colour tells you which side of “no change” most firms sat on, and its height tells you how lopsided the vote was, not how fast output grew. A fall that stays above 50, July’s 55.6 to August’s 54.6, is growth continuing with a smaller majority; the turn worth spotting is a bar crossing the line, last seen December to January. Compare each month with the line first, with last month second.
📅 Tomorrow
Today: ADP private payrolls for August at 8:15 a.m. ET, expected near 47,000 to 48,000 after July’s 44,000; July factory orders at 10, about +0.7% expected after −0.3%; the Bank of Canada at 9:45 a.m. ET, where markets price a 94% chance of a hold at 2.25% after July inflation of 3% and a 50% US tariff; and the Fed’s Beige Book at 2 p.m.. Thursday: ISM services at 10. Friday, 4 September: the August jobs reports for the US and Canada at 8:30 a.m. ET. US markets close Monday, 7 September, for Labor Day; the Fed meets on 15–16 September. Tomorrow’s issue decodes the Bank of Canada’s decision through the loonie row.
One question. Today’s chart showed the factory gauge falling from 55.6 in July to 54.6 in August. Which reading is right? A: US manufacturing shrank in August, because the gauge fell. B: It kept growing, but a smaller majority of purchasing managers reported improvement; the line between growth and contraction is 50, not last month’s reading. C: Factory output rose 4.6% in August, because the gauge sits 4.6 points above 50.
We explain; we never advise. Nothing here is investment advice.
Financial Literature is for educational and informational purposes only. Nothing here is investment, financial, legal, or tax advice, or a recommendation to buy or sell any security. Content is impersonal and not tailored to any individual. Data may contain errors — verify before relying on it. Sources: AP (Tuesday closes, via WTOP); S&P 500; Nasdaq; Dow; Russell 2000; ISM Manufacturing Report On Business, August 2026; ISM PMI (Trading Economics); Motley Fool; Yahoo Finance; Investrade (oil, 10-year); yields, hike odds (Trading Economics); DXY; USD/CAD, USD/MXN; Brent, Hormuz; JOLTS; Reuters via Investing.com (Bank of Canada); Scotiabank release calendar; FOMC calendar; NYSE calendar.
This builds on yesterday’s issue, a red Monday that closed a green August, and Monday’s, the Fed chair who put prices first.
Forwarded this by a friend? Subscribe here. Found it useful? Forward it to one person who’d want it.
— The Editorial Team