Why does America have three inflation numbers, and which one does the Fed watch?
CPI, PCE and PPI measured the same July and printed three different rates. What each one asks, why they disagree, and which one carries the Fed's target.

The short answer: the United States publishes three big inflation gauges because three different questions are worth asking, and each gauge answers only one of them. The Federal Reserve's 2% goal is written on just one of the three, the PCE price index, which is also the slowest of them to arrive.
Set against the same month, July, they read 3.4%, 3.7% and 4.7%. That spread is not a scandal. It is the design.
Three gauges, three questions
The consumer price index asks what households pay at the till. The Bureau of Labor Statistics says the CPI "represents changes in prices of all goods and services purchased for consumption by urban households", with the weight of each item taken from what families report spending in the Consumer Expenditure Survey. The widest version, CPI-U, covers over 90% of the population, and it deliberately leaves out rural households, the armed forces, people in institutions, and anything bought as an investment.
The producer price index asks what firms are paid. It is "a family of indexes that measures the average change over time in selling prices received by domestic producers of goods and services", and the same page names the difference that matters: "PPIs measure price change from the perspective of the seller." About 10,000 of these indexes come out every month, which is why the PPI headline is best treated as a doorway rather than a verdict.
The personal consumption expenditures price index asks what is spent on households, by anyone. The Bureau of Economic Analysis calls it "a measure of the prices that people living in the United States, or those buying on their behalf, pay for goods and services". That last clause is the whole trick: an employer's share of a health insurance premium is a price in the PCE index and invisible in the CPI.
Why the numbers differ
The BEA sorts the gap into named parts. There is a scope effect, because "PCE measures spending by and on behalf of the personal sector, which includes both households and nonprofit institutions serving households; the CPI measures out-of-pocket spending by households", a weight effect, because the two indexes give the same items different importance, and a formula effect, because the PCE index uses a Fisher-Ideal formula that lets the basket shift as shoppers substitute, while the CPI uses a modified Laspeyres formula built on a more fixed basket. The two agencies are not even fully independent of each other: most PCE prices are "derived by extrapolating consumer and producer price indexes from the U.S. Bureau of Labor Statistics".
The chart we ran on Tuesday sets five of them side by side, headline and core, against the line the Fed has promised to return to.
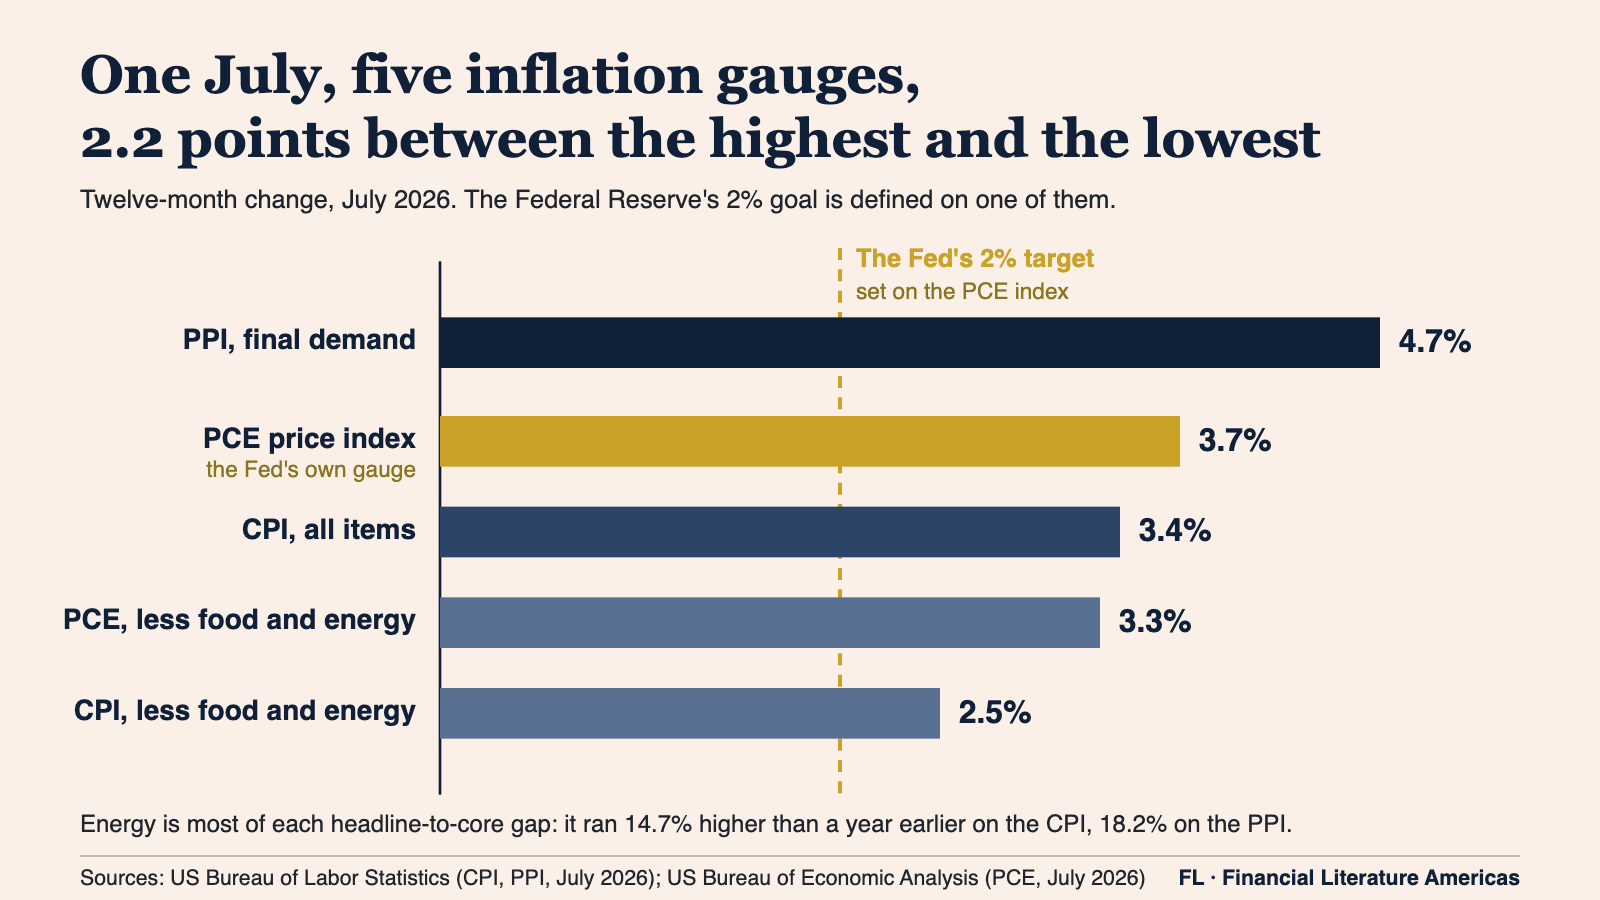
How to read this: ask what each gauge measures before you compare it to anything. The CPI prices a basket bought by urban households, the PCE index prices everything consumed on households' behalf, and the PPI prices what producers receive. Five different questions produce five different answers, so a gap between them is the normal state of the world rather than an error in one of them. Then find the gauge attached to the decision in front of you, because only one of these carries a target.
Which one the Fed watches
The Federal Open Market Committee writes its goal down once a year, and the sentence has not changed: "inflation at the rate of 2 percent, as measured by the annual change in the price index for personal consumption expenditures, is most consistent with the Federal Reserve's statutory mandate", reaffirmed on 27 January 2026. So the CPI is evidence about the target, not the target itself.
The calendar makes that awkward, and knowing the calendar is half the skill. August's producer prices landed on Thursday, 5.4% above a year earlier, and August's consumer prices on Friday, 3.4% over twelve months with the core rate at 2.4%. August's PCE index does not exist yet. It is scheduled for 30 September. For most of any given month, the gauge the Fed targets is a month behind the gauges everyone quotes.
What this is not
None of the three is the true rate with the others as approximations. None of them is your rate either, since every household buys a different basket, and a driver met that 27.4% gasoline rise while a bus rider did not. And a gap between a headline gauge and its core version is not a trick: core simply removes food and energy, which is why the two sit furthest apart when energy is doing the moving, as it was through Thursday's run in crude and diesel.
The habit
Before you react to an inflation headline, name the gauge, the month and the comparison. The archive keeps the daily series, and we will read August's PCE index against all of this when it lands at the end of the month.
Financial Literature is for educational and informational purposes only. Nothing here is investment, financial, legal, or tax advice, or a recommendation to buy or sell any security. Content is impersonal and not tailored to any individual. Data may contain errors, so verify before relying on it. We explain; we never advise. Sources: US Bureau of Labor Statistics, US Bureau of Economic Analysis, Federal Reserve Board.
Forwarded this by a friend? Subscribe here. Found it useful? Forward it to one person who'd want it.
— The Editorial Team