🌏 −3.6% — Japan's households cut spending for an eighth month
Real spending fell 3.6% in July, the steepest since January 2024. In yen it fell 1.5%. The gap is prices. Seoul closed up 1.64%, Tokyo up 1.26%.


Numbers compiled Friday, 4 September 2026, at 6:00 pm in Seoul (UTC+9), a 5-min read. The Seoul, Tokyo, Hong Kong and Shanghai closes are final; the currency, bond and Kuala Lumpur rows are snapshots.
Yesterday's answer: B — because a survey describes the firms it asks, and the private one leans towards smaller, private, export-facing companies while the official one leans towards larger, state-linked firms, so the two can point opposite ways at the same time and the gap tells you which part of the economy grew.
Japanese households spent 3.6% less in July than a year earlier, an eighth straight monthly fall and the steepest since January 2024. Counted in yen rather than in things, the fall was 1.5%. Both numbers are in the same release, and the distance between them is today's lesson. Around it, a good day in the region: Seoul up 1.64%, Tokyo up 1.26%, after Wall Street's best session in a month.
📊 The Dashboard, Friday, 4 September 2026
| Gauge | Level | Move | What this means |
|---|---|---|---|
| KOSPI (South Korea) | 6,687.21 | 🟢 ▲ +1.64% | Closed, final: Google Finance, Investing.com. Institutions bought a net 2.58 trillion won and foreigners 549 billion; Samsung Electronics closed 2.20% higher and SK hynix 3.20%. Chips led again. |
| Nikkei 225 (Japan) | 65,020.94 | 🟢 ▲ +1.26% | Closed, final: Google Finance, Yahoo Finance. Up 806 points, unbothered by the spending figure released the same morning: the 225's earnings are mostly made abroad. |
| Hang Seng (Hong Kong) | ≈25,661 | 🟢 ▲ +1.8% | Closed: Yahoo Finance, Investing.com. Lenovo rose 5.8%, Baidu 5.2% and Meituan 5.0%. |
| CSI 300 (mainland China, rotation row) | 4,548.05 | ⚫ ▼ -0.10% | Closed: Google Finance. Flat while the region rose: the mainland board moves on domestic policy more than on the Fed. |
| USD/KRW | 1,350.4 | 🟢 ▼ won firmer | Seoul's 3:30 pm close, 8.9 won firmer. A country earning record dollars abroad tends to have a firmer currency; today's current-account figure is below. |
| USD/JPY | ≈156.3 | ⚫ little changed | Snapshot at 5:18 pm Seoul: Google Finance. The yen held Thursday's gain rather than extending it. |
| JGB 10-year yield (Japan) | ≈2.92% | 🟢 ▼ -3 bp | Snapshot, 1:10 pm Seoul: 2.917%, from 2.948%. Green because a lower yield means a higher bond price. |
What happened, in plain words
The tone was set in New York on Thursday. Federal Reserve governor Christopher Waller said "three-month inflation has fallen steadily from 4.76% in February. That is a considerable improvement, and the speed of this downward trajectory is encouraging", and added that he would "be inclined to support holding the target for the federal funds rate at its current setting" if that continued. The S&P 500 rose 1%, the Nasdaq 1.4% and the Dow 1.3%; the ten-year Treasury yield eased to 4.74% and the odds of a rise at the September meeting fell to about 50%, from 63%. Cheaper money expected in America lifts share prices everywhere; Asia opened into that.
Korea added a number of its own. The Bank of Korea said the July current account surplus was $42.08 billion, the largest for any July on record and the 39th month in surplus in a row; the goods account alone was $40.43 billion, on exports of $100.4 billion, up 65.3% on the year. That is the same semiconductor boom Tuesday's letter counted, arriving in a different ledger.
🌏 The SEA watch: Malaysia's reserve cover, 0.9 times
The rotation moves to Kuala Lumpur, where the KLCI was 1,708 at midday, down 0.4% and still trading, and the ringgit was 4.05 per dollar. The gauge to learn is a second reading of the reserves we met on Tuesday. Alongside import cover, a central bank reports its reserves against the country's short-term external debt: everything owed abroad that falls due within a year. Bank Negara Malaysia put reserves at $132.1 billion on 31 July and said the position "is sufficient to finance 4.7 months of imports of goods and services, and is 0.9 times of total short-term external debt". Why one? The IMF calls full cover "still the most widely-used standard of adequacy" for emerging markets, and then says the twelve-month cut-off "is essentially arbitrary". Read it as a thermometer, not a verdict; the same paper says it did not predict who suffered most in 2008. It earned its place because in 1997 "heavy foreign borrowing, often at short maturities, exposed corporations and banks to significant exchange rate and funding risks". We describe the gauge; we do not call anything with it.
⭐ Spotlight: Japan's household spending, counted twice
Japan's statistics bureau asks thousands of households each month what they spent. In July the average two-or-more-person household spent 301,245 yen, 1.5% less than a year earlier in nominal terms and 3.6% less in real terms. Nominal counts the money. Real counts what the money bought, after the same office's price index is taken out. The forecast had been a 1.6% real fall, and June's was 3.3%. Month on month, spending edged up 0.5% against an expected 2.6%; a ministry official said consumers "were selective", spending more on entertainment and household goods and less on food and transport. Housing outlays fell 16.4%, utilities 9.2%, while culture and recreation rose 4.8%. The policy angle: markets price roughly 87% odds of a Bank of Japan rate rise this month, on inflation and yields rather than on strong consumption. Masato Koike of Sompo Institute Plus: "downward pressure on consumption is expected to intensify as higher prices become more pronounced".
📈 Chart of the Day: one month, two counts
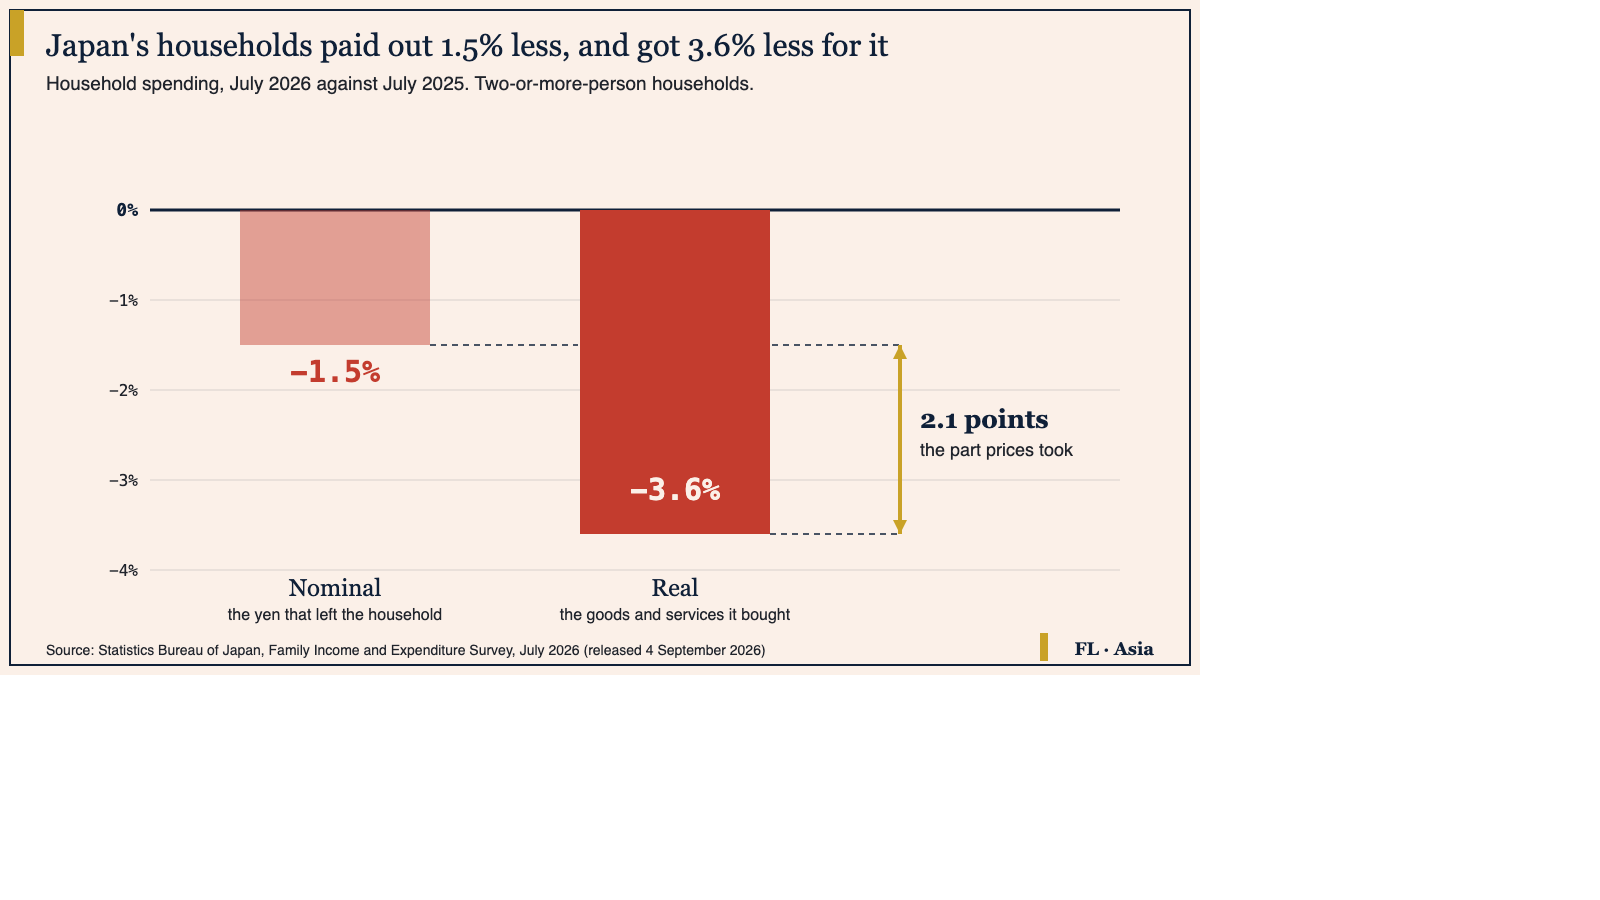
How to read this: whenever a spending, wage or sales figure lands, ask first whether it is nominal or real. Nominal is the money; real is the money after prices are stripped out, so it measures quantity. When prices are rising, the real number is the lower of the two, and the gap between them is roughly the inflation the same statisticians measured. Compare like with like: a nominal wage rise beside a real spending fall tells you nothing until both are on the same footing.
📅 Monday
Tonight at 9:30 pm Seoul the United States publishes August employment. Collected forecasts centre on 56,000 jobs, in a range from minus 25,000 to plus 121,000, with unemployment at 4.1% after July's fall of 23,000. It lands after Asia closes, so Monday's session prices it first, and Monday's Spotlight reads it through the yen and the won. Yesterday's letter read two surveys of one economy.
One question. Today's chart showed Japanese household spending down 1.5% in nominal terms and down 3.6% in real terms, for the same month. Which reading is right? A: The bureau published two estimates and the smaller fall is safer to quote. B: Households paid out 1.5% less money and received 3.6% less in goods and services, because prices rose in between, so the 2.1-point gap is inflation. C: Adding the two gives a 5.1% fall in living standards.
Financial Literature is for educational and informational purposes only. Nothing here is investment, financial, legal, or tax advice, or a recommendation to buy or sell any security. Content is impersonal and not tailored to any individual. Data may contain errors, verify before relying on it. We explain; we never advise. Sources: Statistics Bureau of Japan, Bank of Korea via The Korea Times, Bank Negara Malaysia, IMF, Federal Reserve History, Google Finance, Yahoo Finance, Investing.com, Money Today, Trading Economics, investinglive, Reuters via Investing.com.
Forwarded this by a friend? Subscribe here. Found it useful? Forward it to one person who'd want it.
— The Editorial Team