🌏 China's factories charged 3.8% more, its shoppers paid 0.8%
China's factory gate rose 3.8% in August, consumer prices 0.8%. The gap sits upstream, in mining and energy. Seoul closed above 7,000 after 33 sessions.

Numbers compiled Wednesday, 9 September 2026, at 5:30 pm in Seoul (UTC+9), a 5-min read. The Tokyo and Seoul closes are final; the Hong Kong, currency and bond rows are snapshots near the close.
Yesterday's answer: B. Both figures describe the same three months. The 0.4% is growth on the previous quarter; the 1.4% is what a year would look like if that pace repeated four times. Neither is a forecast.
China's factories charged 3.8% more for what they sold in August than they did a year earlier, and Chinese households paid 0.8% more. Both came from one statistics office at half past nine this morning in Beijing, and the three points between them are the story. Prices are climbing quickly at the start of the production line and barely moving at the end of it. Today's lesson is how to tell which end of that line a price number is measuring.
📊 The Dashboard, Wednesday, 9 September 2026
| Gauge | Level | Move | What this means |
|---|---|---|---|
| Nikkei 225 (Japan) | 65,142.78 | 🔴 ▼ -0.19% | Closed, final: Google Finance, AP. A quiet fall on a firmer yen, not a rout. |
| TOPIX (Japan) | 4,046.64 | 🔴 ▼ -0.09% | Closed: Investing.com. The broad gauge barely moved, so a few large shares did the work. |
| KOSPI (South Korea) | 7,051.64 | 🟢 ▲ +1.40% | Closed, final: Google Finance, Investing.com. The first close above 7,000 in 33 trading sessions. |
| KOSDAQ (South Korea) | 830.37 | 🟢 ▲ +2.28% | Closed: Investing.com. Korea's smaller-company board rose further than the main board. |
| Hang Seng (Hong Kong) | ≈25,244 | 🔴 ▼ ≈0.3% | Still trading when this was compiled: the AP wrap filed 25,244.15, and Investing.com had it lower again late on. |
| USD/JPY | ≈153.3 | 🟢 ▼ yen firmer | Snapshot, still trading: 153.33, from 153.99. A stronger yen shrinks the yen value of what exporters earn abroad. |
| USD/KRW | 1,336.1 | 🟢 ▼ won firmer | Seoul's 3:30 pm close, 9.5 won firmer. A firmer won makes Korean shares cheaper to buy in dollars. |
| JGB 10-year yield (Japan) | ≈2.88% | 🟢 ▼ -3 bp | Snapshot: 2.881%, from 2.909%. Green because a lower yield means a higher bond price. |
What happened, in plain words
Begin with the consumer number, because it is the one that is not moving. Food cost 1.4% less than a year ago, with pork down 11.8%, while everything outside food cost 1.2% more. Take out food and energy and the core rate was 1.0%. It has been mild for a long time: Chinese consumer prices have run under the 2% target for more than three years. The rise from July's 0.5% is mostly fuel: petrol and diesel cost 8.3% more than a year ago, and 6.6% more than in July alone.
The factory figures are a different weather system. The producer rate came in at 3.8%, above the 3.7% collectors expected and above July's 3.5%, and it is concentrated in things dug out of the ground: coal at the mine cost 26.6% more than a year ago, oil and gas extraction 10.5% more. Those are world prices, set well away from Chinese demand, and Brent crude added another 1.6% today to $99.48 a barrel as fighting in the Middle East kept supply tight. Korea spent the day on a different subject: chip shares carried the KOSPI 1.40% higher to 7,051.64, its first close above 7,000 since 23 July.
🌏 The SEA watch: Malaysia's factory gate, up 9.7%
Malaysia publishes the same pair of gauges, and the gap there is wider than China's. Producer prices rose 9.7% in the year to July, the fourth month running in which every sector rose, with mining up 30.5% and crude petroleum extraction up 39.6%. Consumer prices in the same month rose 1.8%, inside the central bank's 1.5% to 2.5% band. Close to eight points separate what Malaysian producers received from what Malaysian households paid. That gap is not a warning on its own. It is a question with three answers: producers pass the cost on, and it reaches consumer prices later; or they absorb it, and it shows in profit margins; or they borrow to bridge it, and it shows in credit. An oil exporter earns on one side of that ledger and pays on the other, which is why the region's producer indexes are worth reading while nothing is on fire.
⭐ Spotlight: the price index that has two sides
China's producer release contains two indexes rather than one, and only the first gets quoted. The factory-gate index measures what industrial firms charge when a product is sold for the first time. Beside it sits the purchase price index, which measures what those same firms pay for the materials and fuel they buy in. In August the first rose 3.8% and the second 5.8%. Across the first eight months the pair reads 2.0% and 3.2%. Firms have been paying more than they have been charging, and that difference comes out of the margin. The inputs responsible sit in the same table: non-ferrous metals and wire up 19.8%, fuel and power up 9.8%, chemical raw materials up 9.5%. It is the one line in an inflation release about company profits rather than household budgets.
📈 Chart of the Day: four prices, one release
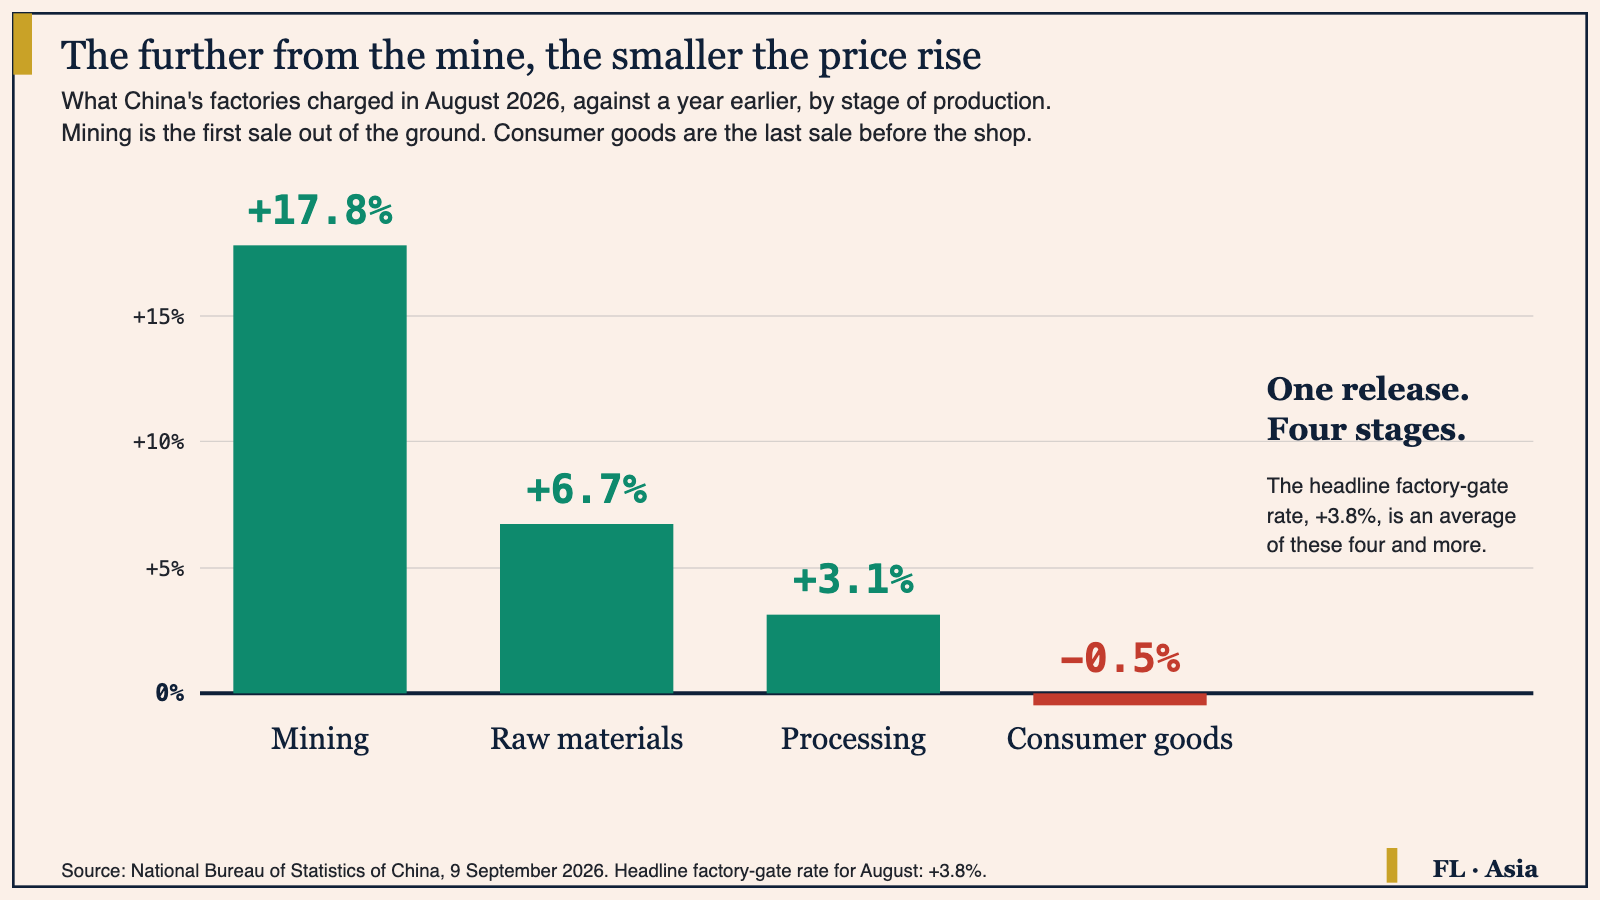
How to read this: before you compare two price numbers, ask where each one is measured. A producer index is collected at every stage of production, so it carries a commodity shock at full strength near the mine and a faded version of it several steps later. A consumer index is collected at the till, after wages, rent, transport and retail margins are added on top. So a large producer number is not automatically consumer inflation on its way: it becomes that only if firms are both able and willing to pass it on. Read the stages before the headline.
📅 Tomorrow
Thursday, 9:30 pm in Seoul: the United States publishes its own August producer prices at 8:30 am in Washington, and the same pass-through question arrives in a second economy; the series sits on BLS on the Data Catalog. Japan follows on Friday at 8:50 am in Tokyo with its corporate goods price index. Yesterday's letter read one growth number on two rulers; the oil letter of 2 September is the other half of today's crude story.
One question. Today's chart showed China's factory-gate prices up 17.8% for mining and down 0.5% for consumer goods, in the same month and the same release. Which reading is right? A: One of the two figures must be an error, because a single release cannot contain both a rise and a fall. B: The two figures measure different stages of production, so a raw-material price move shows at full strength near the mine and weakly or not at all by the last sale before the shop. C: Chinese consumer prices must therefore have fallen in August as well.
Financial Literature is for educational and informational purposes only. Nothing here is investment, financial, legal, or tax advice, or a recommendation to buy or sell any security. Content is impersonal and not tailored to any individual. Data may contain errors, verify before relying on it. We explain; we never advise. Sources: National Bureau of Statistics of China, Department of Statistics Malaysia, US Bureau of Labor Statistics, Bank of Japan, Google Finance, Investing.com, Trading Economics, AP, RTE, InvestingLive, The Star, Hankyung, Business Korea, Money Today.
Forwarded this by a friend? Subscribe here. Found it useful? Forward it to one person who'd want it.
— The Editorial Team