🌏 KOSPI +0.46% — the 3.6% fall that vanished by the close
Seoul opened sharply lower on Warsh and closed higher. Today: China's factory PMI at 49.8, what the 50 line really measures, and Singapore's currency band.

Numbers compiled Monday, 31 August 2026, at 4:50 pm in Seoul (UTC+9), a 4-min read. Seoul and Tokyo closes are final; Hong Kong, Singapore, currency and bond rows are snapshots.
First question below, the answer opens tomorrow's issue.
The KOSPI fell as much as 3.6% this morning and closed up 0.46%. On Friday night Fed Chair Warsh told Jackson Hole that "inflation is running above our 2 percent target. So the Fed's predominant focus right now should be on prices," and that he would be "hard pressed to describe broad financial conditions as restrictive." Futures moved the odds of a September US rate rise from 35% to 57%. Seoul sold at the open, then bought it all back. Today's lesson is a Chinese number that landed at 10:30 am, and the line it sits just below.
📊 The Dashboard — Monday, 31 August 2026
| Gauge | Level | Move | What this means |
|---|---|---|---|
| KOSPI (South Korea) | 6,820.02 | 🟢 ▲ +0.46% | Closed, final: Google Finance, Investing.com. Opened at 6,613.58, down 175 points, touched 6,547.76, closed at its high. The whole fall happened before breakfast. |
| KOSDAQ (South Korea, rotation row) | 834.29 | 🔴 ▼ −0.49% | Closed: Seoul Economic Daily. Opened 2% lower and recovered most of it. When a scare fades, the biggest names heal first. |
| Nikkei 225 (Japan) | 66,311.93 | 🔴 ▼ −0.14% | Closed, final: Google Finance, Yahoo Finance. The low was 64,832.10, 2.4% down, yet 2,065 Tokyo stocks rose against 1,437 that fell. A red index with green breadth: the damage sat in a few heavy chip names. |
| Hang Seng (Hong Kong) | ≈25,516 | 🔴 ▼ ≈ −0.3% | Still trading at compile: Google Finance, 3:25 pm (−0.27%), Investing.com (−0.24%). A snapshot. |
| USD/KRW | 1,368.6 | 🟢 ▼ won firmer | Seoul's 3:30 pm close, 3.9 won stronger after opening at 1,380. Month-end dollar selling by exporters outweighed Warsh. |
| USD/JPY | ≈159.6 | 🟢 ▼ yen firmer | Snapshot: 159.57, after the yen slid beyond 160 per dollar on Friday. 160 is where Tokyo intervened in July: a tripwire, not a number. |
| JGB 10-year yield (Japan) | ≈2.94% | 🔴 ▲ +2 bp | Snapshot: 2.936%, from 2.919%, a whisker under its 52-week high. Markets price about an 80% chance of a Bank of Japan hike in September. |
What happened, in plain words
Warsh spoke after Asia had gone home on Friday, so Monday's open was its first chance to react: Samsung Electronics was down 2.14% and SK hynix 1.94% at 9:15 am. Two things changed the day: China's factory survey at 10:30 am came in better than expected (the Spotlight, below), and exporters converting month-end dollars pushed the won stronger while stocks were still falling, a sign the selling was a mood, not an exit. In the background, US forces struck two launchers on Iran's Larak Island on Sunday and Brent crude rose 2.5% to about $90. A dearer barrel is a tax on every oil-importing economy in this table.
🌏 The SEA watch — this week's number: Singapore's currency band
The rotation returns to Singapore, where the STI was about 5,737 at 3:11 pm, up 0.65% and still trading. The gauge to learn is a policy, not an index. Singapore's central bank sets no interest rate. The Monetary Authority of Singapore steers the exchange rate instead: the Singapore dollar drifts against a basket of trading partners' currencies (the S$NEER) inside a band, and MAS changes only the band's slope, width and centre. A steeper slope means a faster-strengthening currency and cheaper imports; that is how Singapore fights inflation. On 27 July MAS said it "will therefore increase the rate of appreciation of the policy band very slightly," with "no change to the width of the policy band and the level at which it is centred," and kept its 2026 inflation forecasts at 1.5–2.5%. Why it belongs in a 1997 lens: Thailand's peg broke because a fixed price met an emptying reserve tank. A band that slopes and can be re-centred is a price that bends before it breaks. We describe; we don't call.
⭐ Spotlight: China's factory PMI, 49.8, and what the 50 line measures
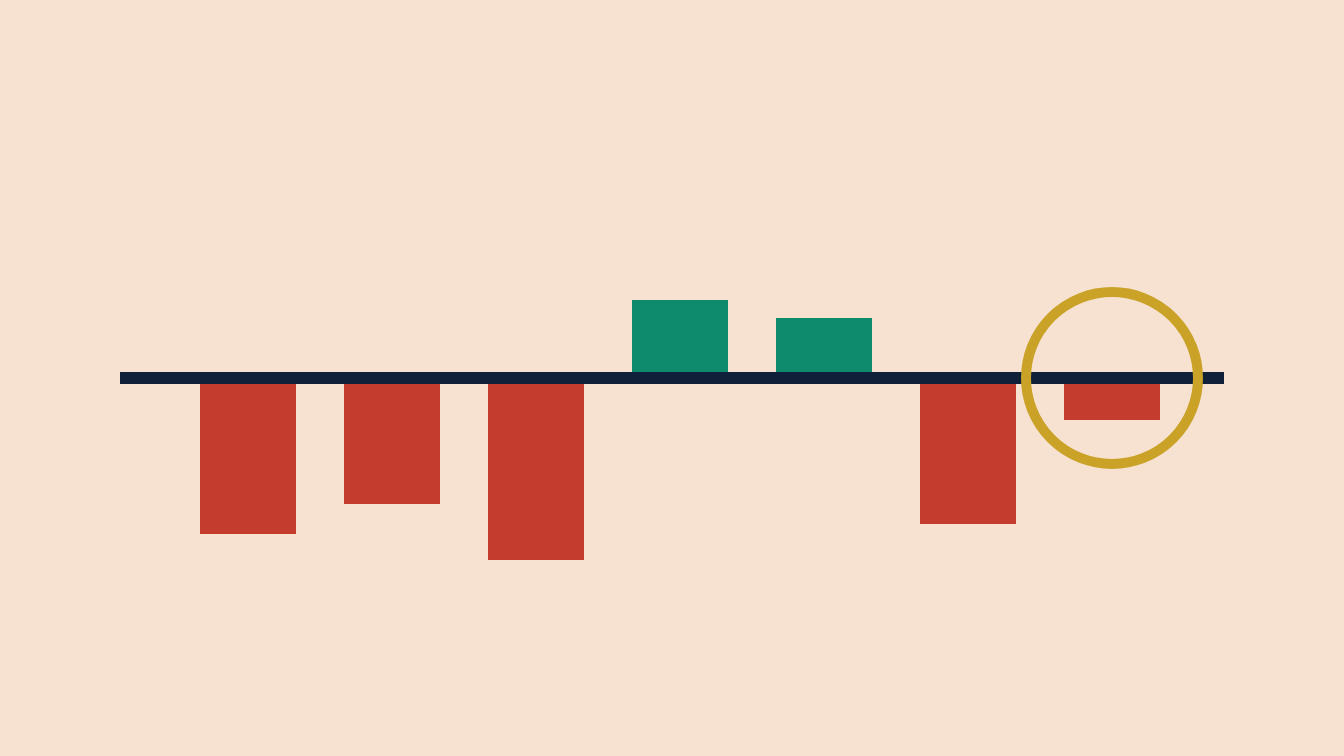
China's official manufacturing PMI rose to 49.8 in August from 49.2, above forecasts; the non-manufacturing index stayed at 49.0. One concept: a PMI is a diffusion index. The statistics bureau asks thousands of purchasing managers whether each part of their business is better, the same or worse than last month; the index is the share saying better plus half the share saying the same. So 50 is an even split, and 49.8 means slightly more said worse. It is not a growth rate: 49.2 to 49.8 does not mean output grew, it means manufacturing shrank in fewer places. Watch the distance from 50, not the direction of the last step.
📈 Chart of the Day — the line is 50, not zero
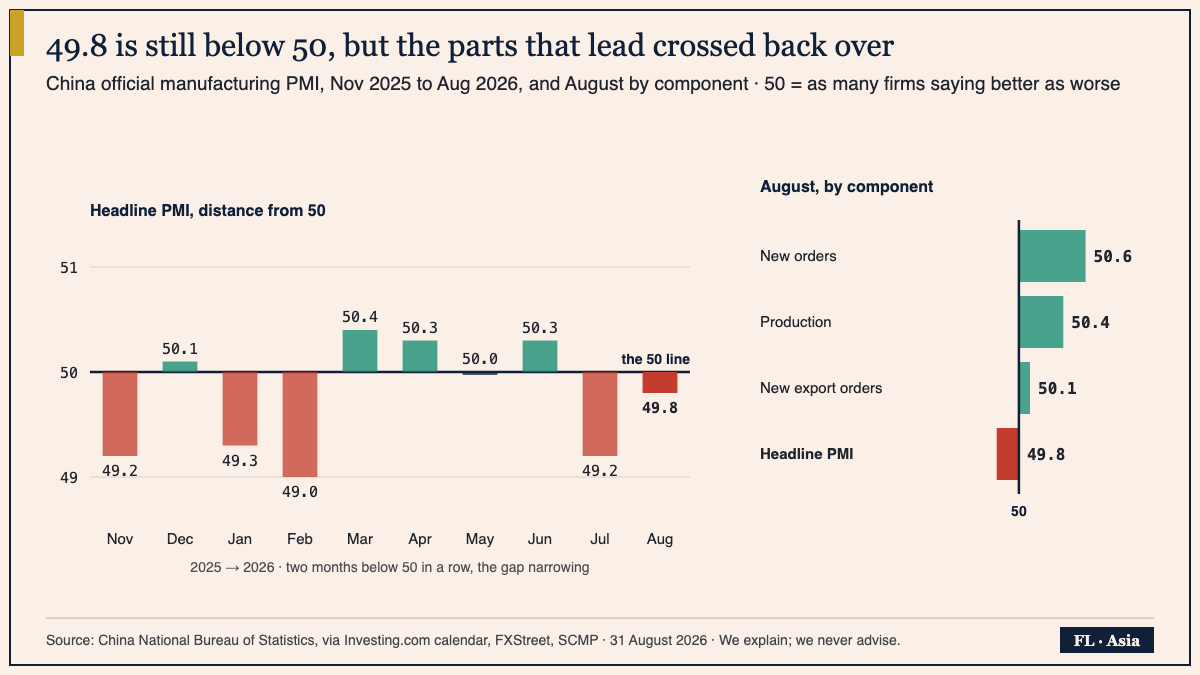
How to read this: read a PMI as a distance from 50, not as a change from last month. A red bar shorter than the one before says "still shrinking, more slowly"; only a bar that crosses the line says "growing". The right-hand panel shows how the headline can sit below 50 while its parts sit above: it blends five components, and employment (48.7) was still pulling it down while new orders (50.6) and new export orders (50.1) had already crossed. Orders lead output, so the parts show which way the headline is leaning.
📐 Monday board: the Growth Lead-Lag Board
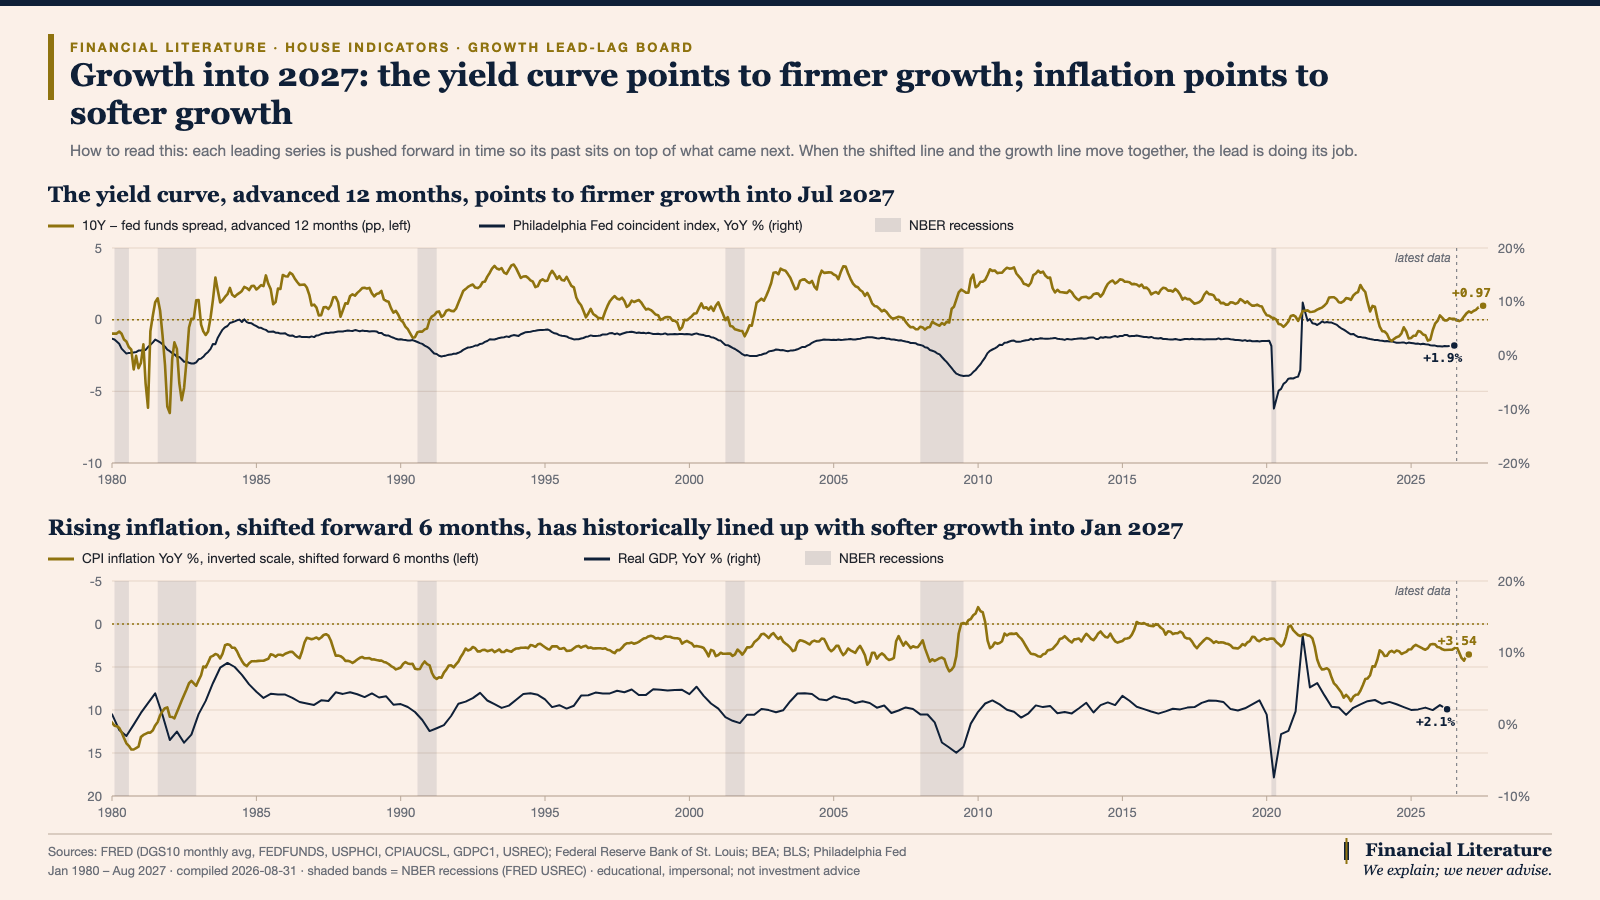
How to read this: each leading series is pushed forward in time so its past sits on top of what came next. Today's readings: "The 10-year minus fed-funds spread was +0.97 pp in Jul 2026 (+0.06 pp a year earlier); advanced 12 months, the curve points to firmer growth into Jul 2027." And: "CPI inflation was 3.5% YoY in Jul 2026 (2.8% six months earlier): shifted forward 6 months, rising inflation has in this gauge's history lined up with softer growth into Jan 2027." Two leads, two directions; neither is a timing tool.
📅 Tomorrow
Tuesday 9 am Seoul: Korea's full-month August trade. A Reuters poll puts the median forecast at exports up 62.6% from a year earlier, after 63% in July, with a $30.74 billion surplus. Watch the USD/KRW row against 1,368.6: a surplus is dollars that eventually get sold for won. Also today: Korea's July industrial output was flat and retail sales fell 2.4%. Related reading: how to read a daily candle; today's KOSPI drew a textbook one.
One question. Today's chart showed China's manufacturing PMI rising from 49.2 in July to 49.8 in August. Which reading is right? A: Factory output grew 0.6% in August. B: Manufacturing is still shrinking, but fewer firms reported worse conditions than in July. C: Manufacturing returned to growth, because the index rose.
Financial Literature is for educational and informational purposes only. Nothing here is investment, financial, legal, or tax advice, or a recommendation to buy or sell any security. Content is impersonal and not tailored to any individual. Data may contain errors — verify before relying on it. We explain; we never advise. Sources: Federal Reserve Board, Google Finance, Investing.com, Yahoo Finance, Seoul Economic Daily, The Korea Herald, FXStreet, investingLive, South China Morning Post, Trading Economics, Reuters, Monetary Authority of Singapore, Mondo Visione, China National Bureau of Statistics, FRED.
Forwarded this by a friend? Subscribe here. Found it useful? Forward it to one person who'd want it.
— The Editorial Team