🌏 Nikkei −1.93% — the week's close, and Japan's import bill in two currencies
Friday's closes, the week's moves, and a Japanese import bill that reads one way in yen and another in the currency the deals were written in.


Asia closed the week with Tokyo lower, Seoul higher, and Friday red in both.
Compiled Saturday, 12 September 2026, at 11 in the morning in Seoul (UTC+9), a 5-min read. This is the week's close, written after every market in it had shut, so every number below is final. The daily column is Friday's move; the week column runs close to close, Friday 4 September to Friday 11 September.
Yesterday's answer (Thursday's question, the last of the week): B. A neutral rate is estimated, not measured. Different models answer the same question differently, so the Bank of Japan publishes their spread rather than one figure, and the nominal version is that estimate plus the 2% target. A target is chosen; this is worked out.
Friday was Tokyo's worst session of the week. The Nikkei 225 closed 1,259.61 points lower at 64,011.34, down 1.93%, and the broader TOPIX lost 0.65% to 4,028.30. Seoul's KOSPI fell 124.01 points to 6,909.91, back under 7,000. Korea's week points the other way: measured Friday to Friday the KOSPI finished 3.3% higher, because Monday alone added 4.61%, while Hong Kong's Hang Seng finished 3.3% lower. One week, one region, opposite signs.
Two prices did most of the work. Brent crude settled at $104.61 on Friday after touching $109.97 in the session, its highest in four months, and ended the week 8.7% up. Borrowing costs rose with it: Japan's ten-year yield ended at 2.987%, 8 basis points higher on the week, ahead of the Bank of Japan's meeting on Thursday and Friday. The yen went the other way and firmed.
📊 The Dashboard, week ending Friday, 11 September 2026
| Gauge | Friday's close | Friday | On the week | What this means |
|---|---|---|---|---|
| Nikkei 225 (Japan) | 64,011.34 | 🔴 ▼ -1.93% | 🔴 ▼ -1.55% | Final: Yahoo, Trading Economics. Friday took back more than the other four built. |
| TOPIX (Japan) | 4,028.30 | 🔴 ▼ -0.65% | 🔴 ▼ -1.83% | Final: Investing.com. Less on Friday, more on the week: wider damage than the 225 showed |
| KOSPI (South Korea) | 6,909.91 | 🔴 ▼ -1.76% | 🟢 ▲ +3.33% | Final: Money Today, Investing.com. Under 7,000 again, still the region's best week. |
| Hang Seng (Hong Kong) | 24,805.63 | 🔴 ▼ -0.60% | 🔴 ▼ -3.30% | Final: Investing.com. Seoul's mirror image, to three hundredths. |
| USD/JPY | 153.55 | 🟢 yen firmer | 🟢 yen firmer, -1.7% | Investing.com, from 156.25. A firmer yen makes imported oil cost less in yen than the dollar price suggests. |
| USD/KRW | 1,345.9 | 🔴 won weaker, 6.7 won | ⚪ little changed | Seoul's 3:30 pm close; the week is the 24-hour rate on Investing.com. A weaker won raises the won price of energy. |
| JGB 10-year yield (Japan) | 2.987% | 🔴 ▲ +8 bp | 🔴 ▲ +8 bp | Investing.com. Red because a higher yield means a lower price for bonds already issued. |
| Brent crude | $104.61 | 🟢 ▼ -2.8% | 🔴 ▲ +8.7% | Investing.com. Green when it falls: Asia buys crude, not sells it. |
What happened, in plain words
A crude price climbing for most of a week does two things to Asia at once. It raises the import bill of economies that buy energy rather than sell it, nearly all of them here, and it lifts the rate the world charges to lend, because lenders want more compensation when they expect higher prices. Both arrived on Friday, which is why the selling was broad rather than selective, and foreign investors were net sellers in Seoul. Korea's week finished green only because of Monday, before the oil price moved. Weekly moves here are close to close, Friday to Friday, a subtraction any reader can do from a free price history such as Stooq on the Data Catalog.
⭐ Spotlight: Japan's Import Price Index, 193.7
The Bank of Japan publishes three price indexes together each month, and the one to learn is the Import Price Index: what Japan pays for goods bought abroad, which for an economy importing almost all its oil, gas and coal is where a world price turns up first. August's preliminary reading was 193.7 against a 2020 base of 100, and 24.8% above a year earlier in yen. People track it because it is the earliest honest gauge of costs firms will either absorb or pass on; the companion Producer Price Index, what those firms charge each other, rose 7.6% in August after 7.7% in July. One caution: August was collected before the week just gone, so its crude line belongs to a cheaper barrel than Friday's.
📈 Chart of the Day: one bill, two currencies
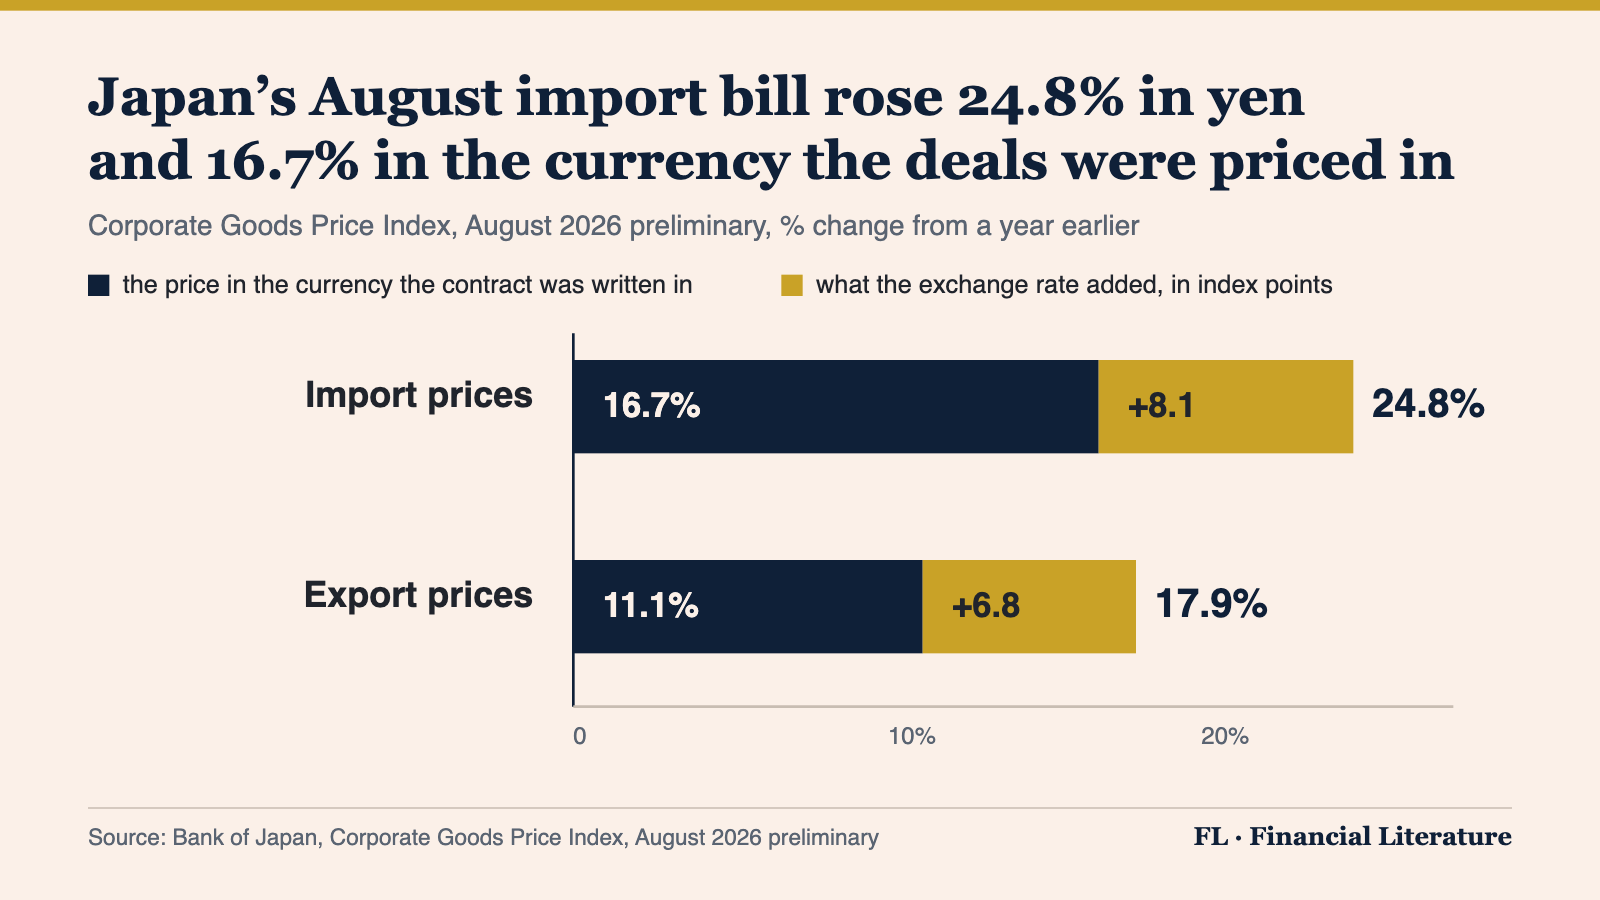
How to read this: when a price index arrives in two currency versions, read the pair, never one alone. The contract-currency line answers what the seller charged, the yen line answers what the Japanese buyer had to find, and the distance between them is the exchange rate doing its work rather than anything changing about the goods. Its sign tells you which way the currency went: a yen figure above the contract figure means the yen was the weaker of the two. So one month can read as a price shock in one currency and an ordinary year in another, and both are correct.
🌏 SEA watch: where a world oil price becomes a pump price
The rotation moves to Vietnam, where the VN-Index closed Friday at 1,795.21 and ended the week 3.1% lower. Vietnam earns the slot because it turns the world oil price into a household price on a published timetable. Retail fuel is capped, and the caps are reset jointly by the Ministry of Industry and Trade and the Ministry of Finance. From 3 pm on Thursday 10 September the ceiling for E5 RON92 petrol rose to 23,744 dong a litre, RON95 to 24,239 and 0.05S diesel to 28,485, every product above the previous reset. Behind the caps sits a Price Stabilisation Fund, created in 2009 and financed by a levy of 300 dong a litre, drawn down to soften a rise and topped up when prices fall; wider measures can follow if retail prices climb 20% inside a month. The gauge to watch is not the index but the distance between the world price and the capped one, because the fund fills it.
📅 Monday, and the week
The region's calendar is back-loaded. China's statistics bureau releases August output, retail sales, investment and house prices at 10 am Beijing time on Tuesday, the fullest read on Chinese demand. The Bank of Japan's board meets Thursday and Friday, and today's chart is part of what it will read. Thursday's letter explained the rate that decision is judged against; Wednesday's read China's factory-gate prices.
One question. Today's chart showed Japan's August import prices up 24.8% in yen and up 16.7% in the currency each contract was written in. Which reading is right? A: They are competing estimates, and the smaller is safer to quote. B: Both describe the same imports, one in the money Japan handed over and one in the money the seller charged, so the 8.1-point difference is the exchange rate. C: Added together they give the true increase of 41.5%.
Financial Literature is for educational and informational purposes only. Nothing here is investment, financial, legal, or tax advice, or a recommendation to buy or sell any security. Content is impersonal and not tailored to any individual. Data may contain errors, verify before relying on it. We explain; we never advise. Sources: Bank of Japan, China NBS, Vietnam's Ministry of Industry and Trade, Google Finance, Yahoo, Investing.com, Trading Economics, Armenpress, Money Today, Businesskorea, VnEconomy.
Forwarded this by a friend? Subscribe here. Found it useful? Forward it to one person who'd want it.
— The Editorial Team