Why do the Nikkei and the TOPIX move differently on the same day?
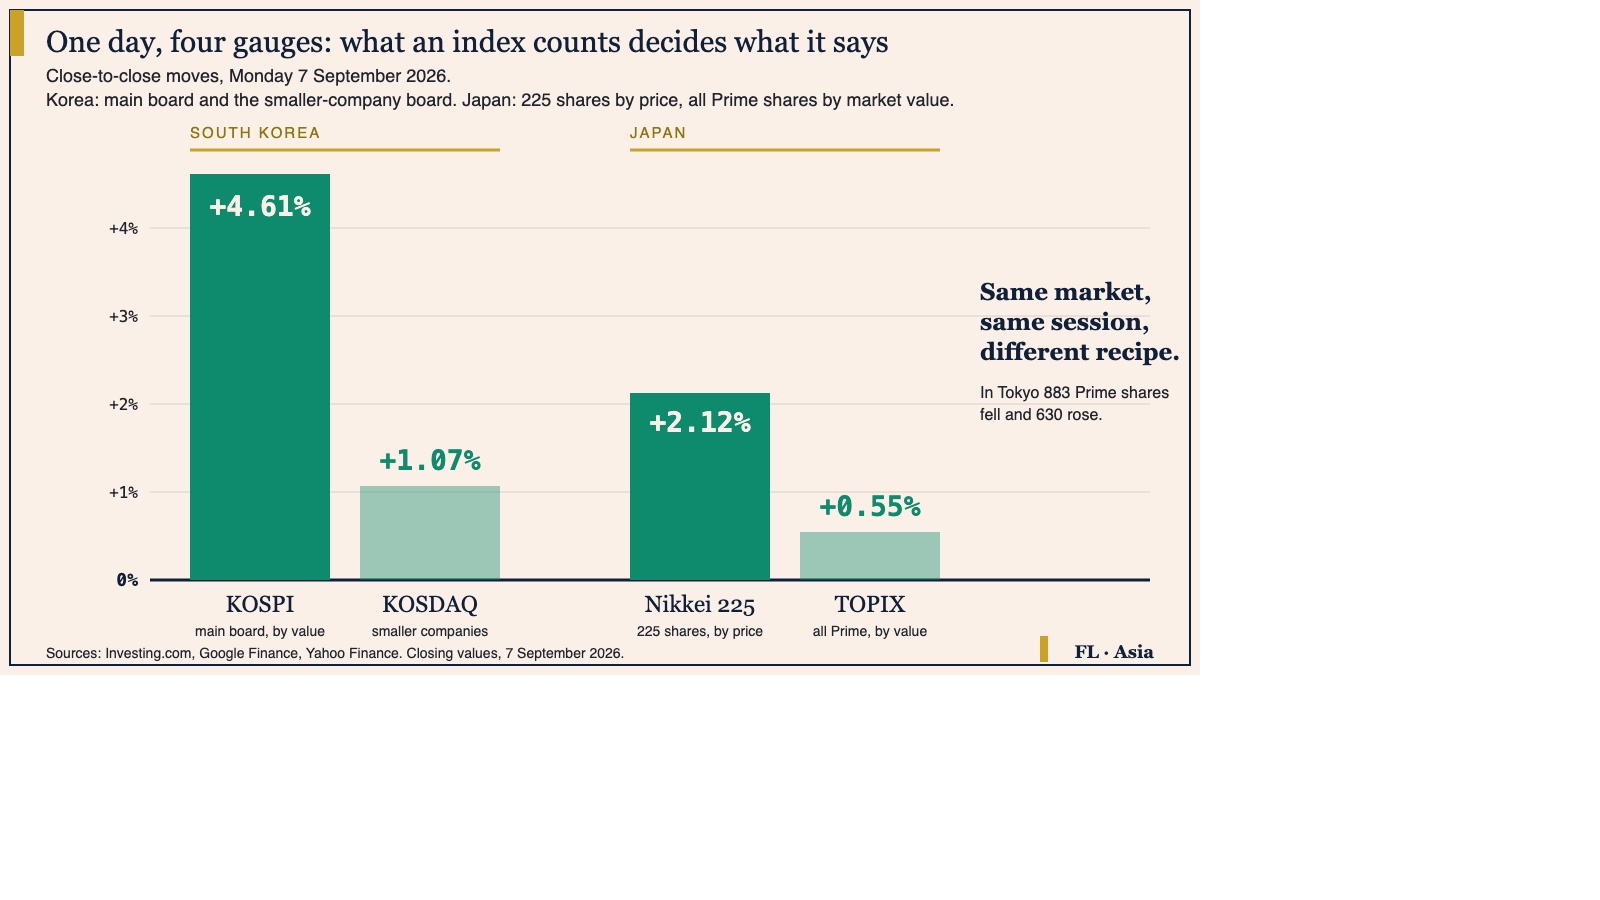
On Monday the Nikkei rose 2.12% and the TOPIX 0.55%, same market, same session. The difference is the weighting rule, and it is worth understanding.

The short answer: Japan's two headline indexes count the same market with different recipes. The Nikkei averages the share prices of 225 companies, so an expensive share counts for more than a cheap one, while TOPIX weighs companies by the value of their tradable shares, so a big company counts for more than a small one.
That single difference is why Monday's session produced two honest answers. The Nikkei 225 closed 2.12% higher and the TOPIX 0.55% higher, on the same exchange, on the same afternoon. Neither number is a rounding error and neither is a misprint.
What each index actually is
The Nikkei Stock Average is a price average. Its publisher's own guidebook says the index "is comprised of 225 stocks listed on the Tokyo Stock Exchange Prime Market and calculated as an adjusted price weight index", and the arithmetic is as plain as it sounds: the adjusted prices of the 225 constituents are added up and divided by a number called the divisor. A share quoted at 50,000 yen therefore pushes the index around far harder than one quoted at 800 yen, whatever the two companies are actually worth. There is a ceiling on how far that can go. The same guidebook sets a weight cap threshold, introduced at 12% in October 2022 and reduced to 11% and then 10% at the reviews of October 2023 and October 2024, above which a constituent's contribution is scaled back.
TOPIX is a value average. The exchange that runs it states that "TOPIX is a free-float adjusted market capitalization-weighted index", measured against a base of 100 points set on 4 January 1968, with real-time calculation beginning on 1 July 1969. Free float means the shares that can actually be bought, so cross-held and long-locked stakes are stripped out first. A company's pull on TOPIX is the value of its tradable shares, not the size of its price tag.
Who uses which, and why both survive
The Nikkei is the older headline. It started on 7 September 1950, was calculated backwards to 16 May 1949, the day the Tokyo exchange reopened after the Second World War, and has been published by Nikkei Inc. since 1970. It is the number in the evening news, and its long unbroken history is genuinely useful. TOPIX is the exchange's own gauge, described on that same page as a benchmark "used as a benchmark for investment in japan stocks", which is the job a broad value-weighted index is built for. Both are kept because they answer different questions, and on most days the answers are close enough that nobody notices.
How to read this: before you compare two index moves, find out what each one counts and how it weights what it counts. Ask three questions: how many companies are in it, are they weighted by share price or by market value, and how much of the total sits in the top two or three names. A number that looks like a verdict on a whole economy is often a verdict on a handful of its largest listed companies. When a narrow index and a broad one from the same market disagree, the disagreement is the information.
How to read a gap between them
Start with the direction of the gap. When the price-weighted index runs far ahead, expensive shares did the work, and in Tokyo those are mostly technology and chip-related names. When the value-weighted index runs ahead instead, the day belonged to the big, ordinary, moderately priced companies that make up most of the market's value.
Then check breadth, which is the count of shares that rose against the count that fell. On Monday the Prime Market had 883 shares falling and 630 rising while both indexes closed higher. A rising index with falling breadth is telling you that the move was concentrated, and concentration is a fact about the recipe rather than a fact about Japan.
What this is not
It is not a sign that one index is wrong. Both closes are correct answers to different questions, and the gap between them is arithmetic, never a flow of money or a measure of foreign buying. It is not a Japanese peculiarity either: Korea's main board has the same family of problem from the other direction, where Samsung Electronics and SK hynix together passed 50.44% of the entire KOSPI's market value in May, so a KOSPI chart is substantially a memory-chip chart. And it is not permanent. The Nikkei reviews its constituents twice a year, with base dates at the end of January and July and changes taking effect on the first trading day of April and October, so the recipe itself moves.
The habit
When two gauges of one market disagree, read the method before you read the move. We used that habit on Monday, when four Asian gauges gave four different answers to one session, and again on Saturday, reading Japan's import bill in two currencies, where the same number looked like a shock in yen and an ordinary year in dollars. The archive keeps the daily series.
Financial Literature is for educational and informational purposes only. Nothing here is investment, financial, legal, or tax advice, or a recommendation to buy or sell any security. Content is impersonal and not tailored to any individual. Data may contain errors, so verify before relying on it. We explain; we never advise. Sources: Nikkei Inc., Japan Exchange Group, News on Japan, Seoul Economic Daily.
Forwarded this by a friend? Subscribe here. Found it useful? Forward it to one person who'd want it.
— The Editorial Team