🌍 2.50% — the ECB raised again, and still sees 2.1% inflation in 2028
Thursday's rate rise, Friday's closes and a red week for every European board, plus a projection that narrows the gap to 2% without closing it.

The European Central Bank raised interest rates on Thursday afternoon, and Europe's markets closed the week lower anyway.
Compiled Saturday, 12 September 2026, at 11 in the morning in Frankfurt (CEST, UTC+2), a 5-min read. This is the week's close, written after every market in it had shut, so every number below is final. The daily column is Friday's move; the week column runs close to close, Friday 4 September to Friday 11 September.
Yesterday's answer (Thursday's question, the last of the week): B. A price index adds each item's change multiplied by its share of household spending rather than averaging the items. Heating oil is a small slice of the German household energy bill, so a 49.6% rise on it was outweighed by electricity 5.5% cheaper and gas 2.9% cheaper, which sit in almost every household's budget.
The Governing Council raised the three key ECB rates by 25 basis points, taking the deposit facility to 2.50%, the main refinancing operations to 2.65% and marginal lending to 2.90%, all with effect from Wednesday 16 September. It is the second rise of this cycle, after June took the deposit rate from 2.00% to 2.25%, and the Bank named the reason plainly: the conflict in the Middle East and the war in Ukraine "have pushed the path of energy prices up further".
Markets spent the week pricing that path rather than the decision. Every board below rose on Friday and every one fell across the week, the STOXX 600 finishing 0.5% up on the day and about 1.6% down on the week. Government borrowing costs moved the other way: the ten-year Bund ended at 3.50%, some 16 basis points above the previous Friday, and the ten-year gilt at 5.35%, about 21 higher. The euro barely moved at all.
📊 The Dashboard, week ending Friday, 11 September 2026
| Gauge | Friday's close | Friday | On the week | What this means |
|---|---|---|---|---|
| STOXX 600 (pan-Europe) | 639.10 | 🟢 ▲ +0.49% | 🔴 ▼ -1.66% | Final: Investing.com, Trading Economics. A green Friday inside a red week. |
| DAX (Germany) | 25,568.56 | 🟢 ▲ +0.82% | 🔴 ▼ -1.83% | Final: Investing.com. The heaviest weekly fall of the four. |
| FTSE 100 (UK) | 10,650.44 | 🟢 ▲ +0.39% | 🔴 ▼ -1.67% | Final: Investing.com. London fell with the rest despite a separate central bank. |
| CAC 40 (France, rotation row) | 8,179.77 | 🟢 ▲ +0.78% | 🔴 ▼ -1.20% | Final: Investing.com. The mildest of the four. |
| EUR/USD | 1.1600 | ⚪ -0.10% | ⚪ little changed | Investing.com, from 1.1614. A rate rise everyone expected leaves a currency where it was. |
| GBP/USD | 1.3520 | ⚪ +0.07% | ⚪ little changed | Investing.com, from 1.3523 a week earlier. |
| Bund 10-year yield | 3.50% | ⚪ ▲ +1 bp | 🔴 ▲ +16 bp | Investing.com. Red because a higher yield means a lower price for bonds already issued. |
| Gilt 10-year yield (UK) | 5.35% | 🟢 ▼ -3 bp | 🔴 ▲ +21 bp | Investing.com. The week's largest move of the two. |
| Brent crude | $104.61 | 🟢 ▼ -2.8% | 🔴 ▲ +8.7% | Investing.com. It touched $109.97 in Friday's session. Europe buys crude, so green when it falls. |
What happened, in plain words
A rate decision that everybody expects does very little to prices on the day it arrives, which is why the euro ended the week almost exactly where it started. What moves is the path beyond the decision, and that is what the week repriced: an oil price up 8.7% in five sessions makes every future inflation reading a little higher, so lenders asked for more to lend for ten years and shares of companies that borrow were marked down accordingly. The same logic reached London, where the central bank meets on its own timetable. Both yields above are daily series a reader can pull, the UK ones from the Bank of England Database on the Data Catalog.
⭐ Spotlight: Britain's monthly GDP, +0.4%
Britain is one of very few large economies that estimates its national output every month rather than every quarter, and Friday morning brought July's. Output grew 0.4% in July after 0.3% in June, and 0.4% across the three months to July, with services up 0.6% while production and construction each fell 0.5%. People track the monthly series because it dates the turns a quarterly number can only average. Its own publisher leads on the three-month window, though, and that is the habit to copy: one month is a small, frequently revised figure that a single shutdown or a warm week can move.
📈 Chart of the Day: the distance still to run
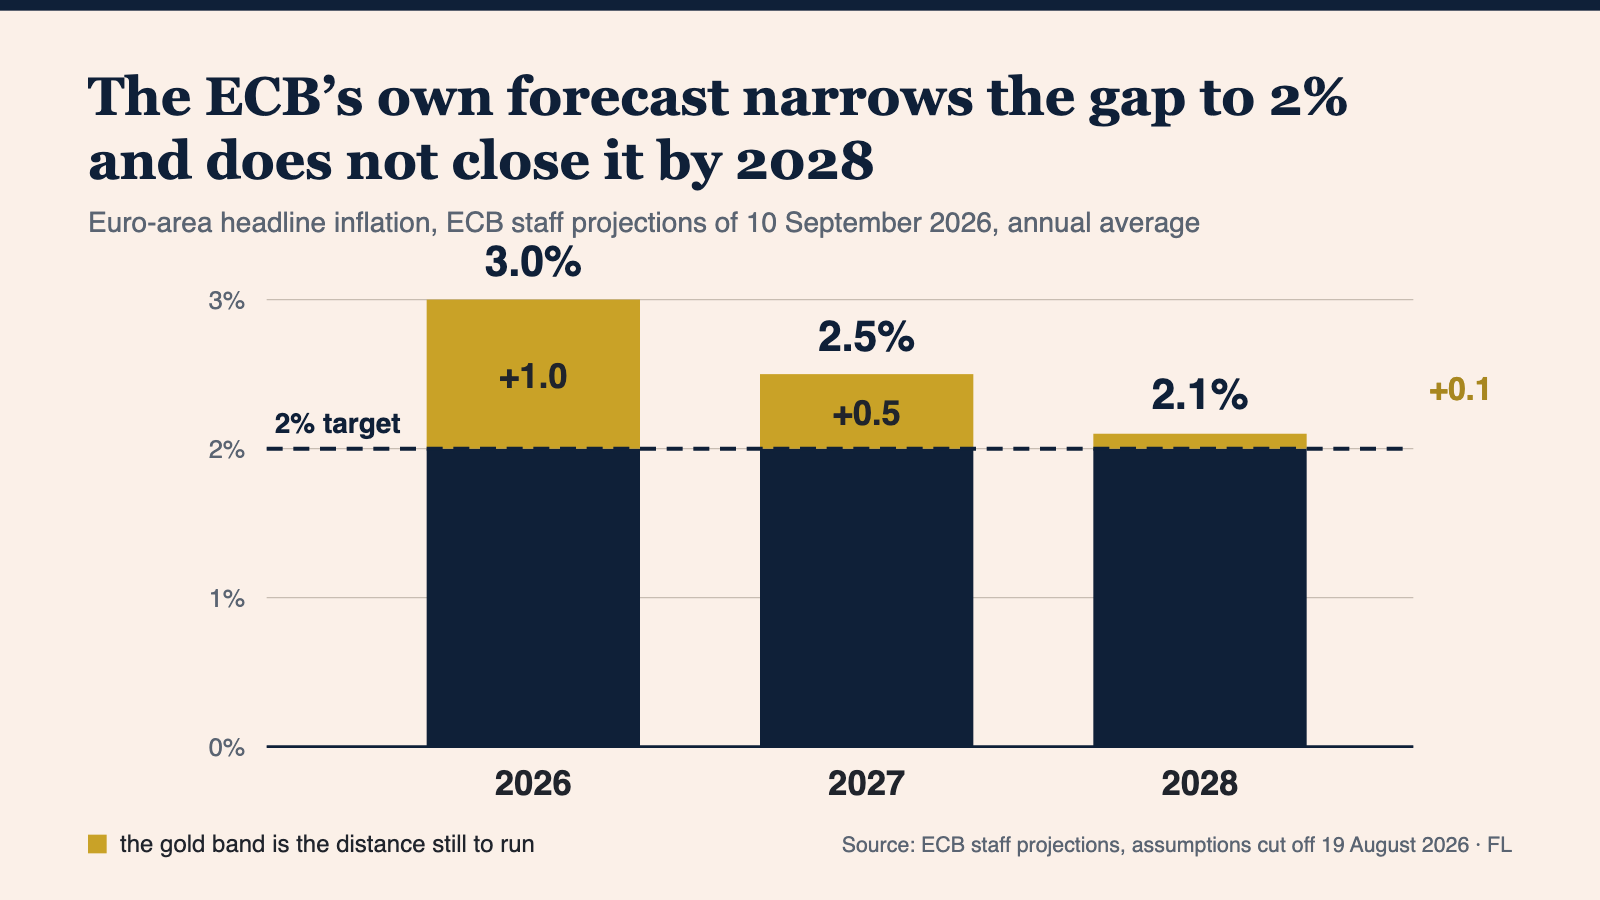
How to read this: a central-bank projection is not a promise and not a forecast of what the bank will do. It is what the staff expect if a stated set of assumptions holds, so read the assumptions before the bars. These were frozen on 19 August, with oil assumed to average $88 a barrel this quarter; Brent closed Friday at $104.61. Then take two things off the chart: the year the path is meant to reach target, and how much distance is left in each year before it. The gap, not the level, is what a rate decision argues about.
📅 Monday, and the week
The week is built around three central banks. The ECB's new rates take effect on Wednesday. The Bank of England's Monetary Policy Committee announces on Thursday, with Bank Rate at 3.75% since its last change and Friday's growth figure now on the table. The Federal Reserve decides on Wednesday evening, European time, and European bond desks will read it as closely as their own. Thursday's letter showed how weights hide an energy shock inside a household bill; last week's traced the same shock through the factory gate.
One question. Today's chart showed the ECB projecting inflation of 3.0% in 2026, 2.5% in 2027 and 2.1% in 2028, against a 2% target. Which reading is right? A: The ECB has committed to delivering those three numbers. B: They are what the staff expect if the assumptions behind them hold, including an oil price fixed weeks before publication, so the assumptions have to be read with the bars. C: Because 2.1% is close to 2%, the target is effectively met and rates will stop rising.
Financial Literature is for educational and informational purposes only. Nothing here is investment, financial, legal, or tax advice, or a recommendation to buy or sell any security. Content is impersonal and not tailored to any individual. Data may contain errors, verify before relying on it. We explain; we never advise. Sources: European Central Bank, UK Office for National Statistics, Bank of England, Investing.com, Trading Economics, Reuters via Investing.com.
Forwarded this by a friend? Subscribe here. Found it useful? Forward it to one person who'd want it.
— The Editorial Team