🌍 5.8% — Europe's factory-gate prices jumped; energy did all of the month's rise
Euro-area producer prices rose 1.6% in July alone and 5.8% on the year; energy +5.6% on the month, the rest flat. Bond yields paused. Today: the pipeline.


Compiled Thursday, 3 September 2026, at about 12:00 pm in Frankfurt (CEST, UTC+2), a 5-min read. Index rows are final Wednesday closes; bond and currency rows are Thursday-morning snapshots, still trading, and say so.
Yesterday's answer: B — because a ten-year yield is built from expected policy rates, expected inflation and a premium for uncertainty and supply, so a gap between two countries at the same maturity reflects those expectations, not a default verdict; and a rising yield means the bonds already issued fell in price.
Prices at the euro area's factory gates rose 5.8% in the year to July, from 4.6% in June, and 1.6% in July alone; energy was 5.6% dearer on the month and everything else, taken together, cost what it cost in June. Bond yields paused this morning after a week of records. Today's lesson is what a producer price index is, and why it arrives before the shop price.
📊 The Dashboard, Wednesday, 2 September 2026 (closes)
| Gauge | Level | Move | What this means |
|---|---|---|---|
| STOXX 600 (pan-Europe) | 645.91 | 🔴 ▼ −0.24% | Final (Investing.com, Google Finance). A second day at a one-month low. Utilities fell as gas prices rose, telecoms rose; LVMH lost 1.2% to a 14-month low, Nokia gained on rejoining the STOXX 50 and Volkswagen fell almost 4% on leaving it. |
| DAX (Germany) | 25,839.33 | 🔴 ▼ −0.50% | Final (Investing.com, Google Finance). Siemens down 0.9%; Deutsche Bank up 2.4% and Commerzbank 1.5%: lenders earn more when rates rise, so a bond sell-off can be a bank rally. |
| FTSE 100 (UK) | 10,756.45 | 🔴 ▼ −0.30% | Final (Investing.com, Google Finance). This morning's final UK services PMI for August was 52.5, from 52.1: above 50, growing. |
| Tadawul All Share (Saudi Arabia, rotation row) | 11,012.18 | 🔴 ▼ −0.80% | Wednesday close (Investing.com, Google Finance), a third fall in a row with Brent at $95. An oil exporter's stock index is not an oil price: it holds banks, telecoms and petrochemicals too. Gulf markets trade Sunday to Thursday; Riyadh was 0.5% higher at 11:37 am, still trading. |
| EUR/USD | 1.1578 | ⚪ small | Wednesday's ECB reference rate, from 1.1590. Thursday, still trading: 1.1609 at 10:50 am. Steady against the dollar; down more than 1% against the yen, to 181.62. |
| GBP/USD | ≈1.350 | ⚪ flat | Thursday snapshot, still trading: 1.3499 at 10:49 am. |
| Bund 10Y yield | 3.38% | 🔴 ▲ +4 bp | Wednesday close (Investing.com, Trading Economics), after touching 3.4%, the highest since April 2011. Thursday, still trading: 3.36%, the first fall in seven sessions. Red because a higher yield means a lower bond price. |
| Gilt 10Y yield (UK) | ≈5.19% | 🟢 ▼ −4 bp | Thursday snapshot, still trading (Investing.com, Trading Economics), from about 5.23% at Wednesday's close and the 5.28% in yesterday's letter. Green because the bond price rose. |
Thursday, live: at about 10:35 am the STOXX 600 is 647.5, up 0.2%; the DAX 25,908, up 0.3%; the FTSE 100 10,767, up 0.1%; the CAC 40 8,272, down 0.1%. Deutsche Telekom is up 1.4% on reports of an Elliott stake. Brent is about $95.5. Snapshots, not closes.
What happened, in plain words
Wednesday was a third day of the same weather: oil near $95, bonds falling, shares drifting. Bundesbank president Joachim Nagel told Le Monde that "markets are pricing in a probability of more than 95% that we will raise interest rates at our September meeting", and that inflation "stands at around 3% rather than 2%". The deposit rate is 2.25%; the decision comes next Thursday in Berlin.
The turn came from America. ADP said private employers added 38,000 jobs in August against 47,000 expected, and New York Fed president John Williams said "there are no clear signs right now that a September rate hike would be needed to bring down inflation". The S&P 500 rose 0.5% to 7,666.60; the odds of a Fed rise on 16 September slipped to 61%. Overnight the yen jumped more than 1% after Bank of Japan board member Hajime Takata said rate rises should come "nimbly". By the European open, the ten-year Treasury was 4.77%, the Bund 3.36% and France's ten-year still rising, 4.24%, a seventh session. Then, at 11 am, Eurostat's producer prices.
⭐ Spotlight: the producer price index, 5.8%
A producer price index measures what producers charge for their goods at the factory gate: before transport, shop margins and VAT. The consumer price index, the one the ECB targets, measures what households pay. People track the PPI because it moves first. Energy and raw materials reach a producer's costs, and its prices, within weeks; the shop price follows over months, and only if the producer can pass the cost on. July's print: up 1.6% on the month and 5.8% on the year, after 4.6% in June; 4.7% had been expected. By stage, on the year: energy 12.9%, intermediate goods 6.3%, durable consumer goods 2.9%, capital goods 2.6%, non-durable consumer goods −0.7%, everything except energy 3.1%. On the month, Ireland rose 4.3%, Spain and Italy 3.0%, Estonia fell 3.3%. Set it beside Tuesday's consumer print: energy 14.3% at the till, 12.9% at the gate; core 2.4%. Same shock, two ends of one pipe.
📈 Chart of the Day: the pipeline
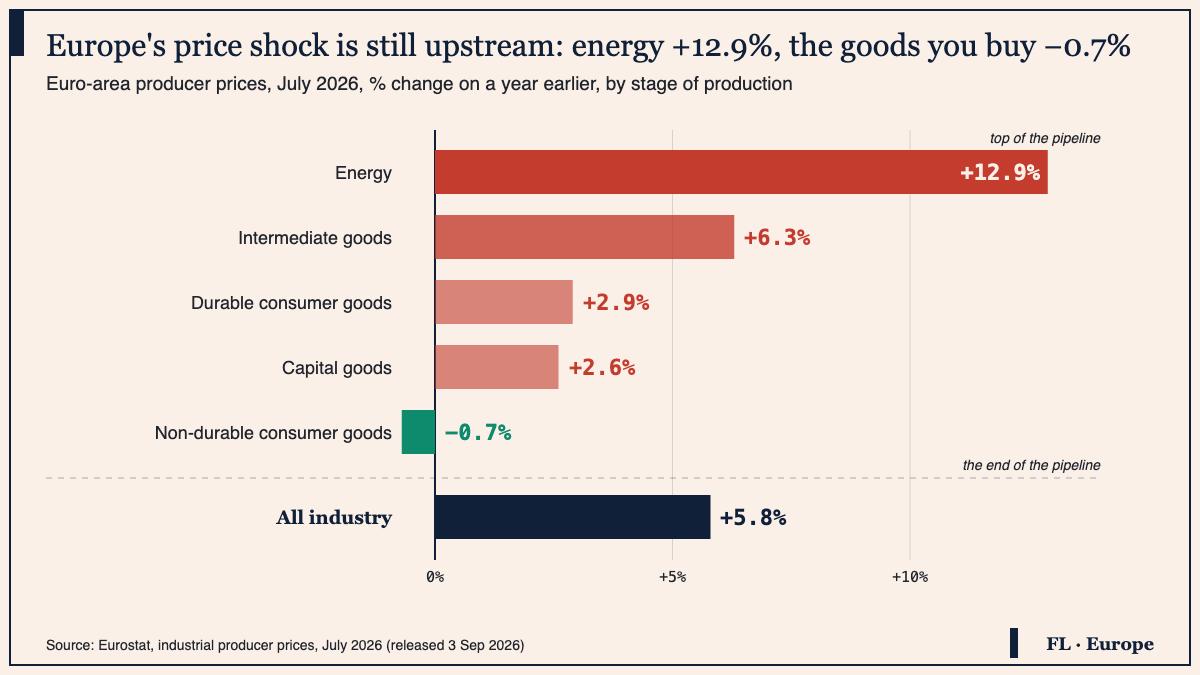
How to read this: read a PPI by stage, not by its headline. Energy sits at the top of the pipeline, intermediate goods (steel, chemicals, packaging) one step down, consumer goods at the end. When the bars shrink as you move down, the shock is still travelling; when the consumer-goods bars start to grow, it has arrived. Then open the consumer index for the same month and read core: that is the far end of the pipe.
📅 Tomorrow
This afternoon, 2:30 pm: US jobless claims; 4 pm, the ISM services index, expected near 54.1; Fed governor Waller speaks. Friday, 8 am: Germany's July factory orders, consensus up 0.5% after June's 3.1% jump. Friday, 2:30 pm: the US jobs report, forecasts near 56,000 jobs and 4.1% unemployment. The ECB decides on 10 September; the Bank of England on 17 September.
One question. Today's chart showed July producer prices up 12.9% for energy, 6.3% for intermediate goods and down 0.7% for non-durable consumer goods. Which reading is right? A: Makers of consumer goods are cutting prices, so the energy shock is over. B: The shock is still travelling down the pipeline: it has reached the middle stage but not the goods households buy, so read the core consumer rate to see how much has arrived. C: The 5.8% headline means shop prices will rise 5.8%.
Financial Literature is for educational and informational purposes only. Nothing here is investment, financial, legal, or tax advice, or a recommendation to buy or sell any security. Content is impersonal and not tailored to any individual. Data may contain errors — verify before relying on it. We explain; we never advise. Sources: Eurostat, Trading Economics, Investing.com, Google Finance, European Central Bank, Anadolu Agency, Reuters via AOL, AP via WTOP, Yahoo Finance, FXStreet, MoneyWeek.
Forwarded this by a friend? Subscribe here. Found it useful? Forward it to one person who'd want it.
— The Editorial Team