🌍 3.3% — energy pushed euro-area inflation up; core slipped to 2.4%
Euro-area inflation rose to 3.3% in August from 2.9%. Energy did it, up 14.3%; core slipped to 2.4%. Today: how to read headline against core.

Compiled Tuesday, 1 September 2026, at about 12:30 pm in Frankfurt (CEST, UTC+2), a 5-min read. Index and bond rows are final Monday closes; the FTSE row is Friday's close, London was shut Monday; currency rows and this morning's Eurostat prints are Tuesday items, and say so.
Yesterday's answer: A — because the national rate weights each state by its share of spending, so it lands inside the states' range and nearer the big ones. At 2 pm it did: Germany's August flash was 2.9%, the North Rhine-Westphalia and Bavaria number.
Euro-area inflation rose to 3.3% in August, from 2.9% in July, and almost all of the rise is energy; the rate the ECB reads through, core, slipped to 2.4%.
📊 The Dashboard, Monday, 31 August 2026 (closes)
| Gauge | Level | Move | What this means |
|---|---|---|---|
| STOXX 600 (pan-Europe) | 651.10 | 🔴 ▼ −0.62% | Final (Investing.com, Google Finance). Oil up, yields up, so energy shares rose and industrials fell; August as a whole still ended higher, the fifth monthly gain in a row. |
| DAX (Germany) | 26,258.11 | 🔴 ▼ −1.17% | Final (Investing.com, Google Finance). Europe's worst board on Monday; Siemens Energy and ASML led the fall, TotalEnergies and Eni gained. Wires printed −1.09% at the bell; this is the settle. |
| FTSE 100 (UK) | 10,824.26 | ⚪ closed | Friday's close; Monday was the summer bank holiday. Tuesday, live: 10,733.73, down 0.84% at 11:45 am London, still trading. |
| CAC 40 (France) | 8,334.50 | 🔴 ▼ −0.79% | Rotation row, final (Investing.com, Google Finance). |
| EUR/USD | 1.1596 | 🔴 ▼ small | Monday's ECB reference rate, from 1.1643 on Friday. Tuesday, still trading: 1.1591 at 10:44 am UTC; the inflation print barely moved it. |
| GBP/USD | ≈1.354 | ⚪ flat | Tuesday snapshot, still trading: 1.3535 at 10:45 am UTC, little changed from Monday morning's 1.3545. |
| Bund 10Y yield | 3.32% | 🔴 ▲ +5 bp | Monday close, final: Investing.com has 3.3233%, from 3.2733%; Trading Economics: the highest since May 2011. Tuesday morning 3.35%, still trading. Red because a higher yield means a lower bond price. |
Tuesday, live: at about 12:30 pm the STOXX 600 is at 647.5, down 0.55%; the DAX down 0.9% at 26,019; the CAC 40 down 0.3%. BP is up 3.5%, Shell and TotalEnergies 1.3 to 1.4%; SAP is down 2.7%, Siemens 1.5%; Novartis is up nearly 4% on trial results for an oral multiple-sclerosis drug. Brent is about $92. Snapshots, not closes.
What happened, in plain words
At 11 am Eurostat published its flash estimate for August: prices 3.3% higher than a year earlier, after 2.9% in July; energy 14.3% higher, after 10.3%; services 3.0%, after 3.3%; non-energy goods 1.2%, after 0.9%; food, alcohol and tobacco 1.2%, unchanged. Prices rose 0.4% on the month, energy alone 2.9%; Lithuania had the highest rate at 5.8%, Estonia the lowest at 1.3%. The big four: Spain 4.5%, Italy 3.2%, Germany 2.9%, France 2.7%. Same release day, a quieter number: euro-area unemployment was 6.4% in July, unchanged from June.
Germany's own print landed Monday at 2 pm: 2.9% on both the national and the harmonised measure, energy up 10.5% after 8.3%, core unchanged at 2.4%, a touch below the 3.0% and 3.1% forecasts, and rate expectations did not move.
The oil behind the energy line is still being priced. After Sunday's US strike on Larak Island, two supertankers leaving the Gulf, Bahri's Sidr and Sinokor's Senegal Prosperity, were hit by projectiles off Khasab, Oman, this morning; Brent rose above $92. The ECB meets in nine days. Reuters' read this morning: a rise in the deposit rate to 2.50% on 10 September is widely expected and already priced; the debate is whether October is skipped. Oxford Economics' Leo Barincou, to Euronews: "underlying price pressures remained contained as services inflation came down".
⭐ Spotlight: core inflation, 2.4%
Core inflation is the same price index with four things taken out: energy, food, alcohol and tobacco. Those four are removed not because they do not matter to a household (they matter most) but because their prices are set by weather, harvests and, this year, the Strait of Hormuz, none of which a central bank can move. People track core for one reason: it shows whether an energy shock is staying in the energy line or leaking into everything else, through transport costs, wages and menus, what economists call second-round effects. Today the leak is not visible: headline rose four tenths while core fell a tenth and services slowed to 3.0%.
So why does the ECB still look set to raise its rate, 2.25% since 17 June? Because its target is 2% on the headline rate over the medium term, not on core, and because its July account already recorded a September hike as "almost fully priced in". Our own oil board adds context: WTI averaged $84 in Aug 2026 against a $68 simple fair-value estimate from the trade-weighted dollar and 5-year breakeven inflation (+23% gap; R² 0.52 since 2006). A two-variable fit, a reading aid, not a forecast. Friday's letter read France and Spain; Monday's read Germany's states; today the whole.
📈 Chart of the Day: one bar did the work
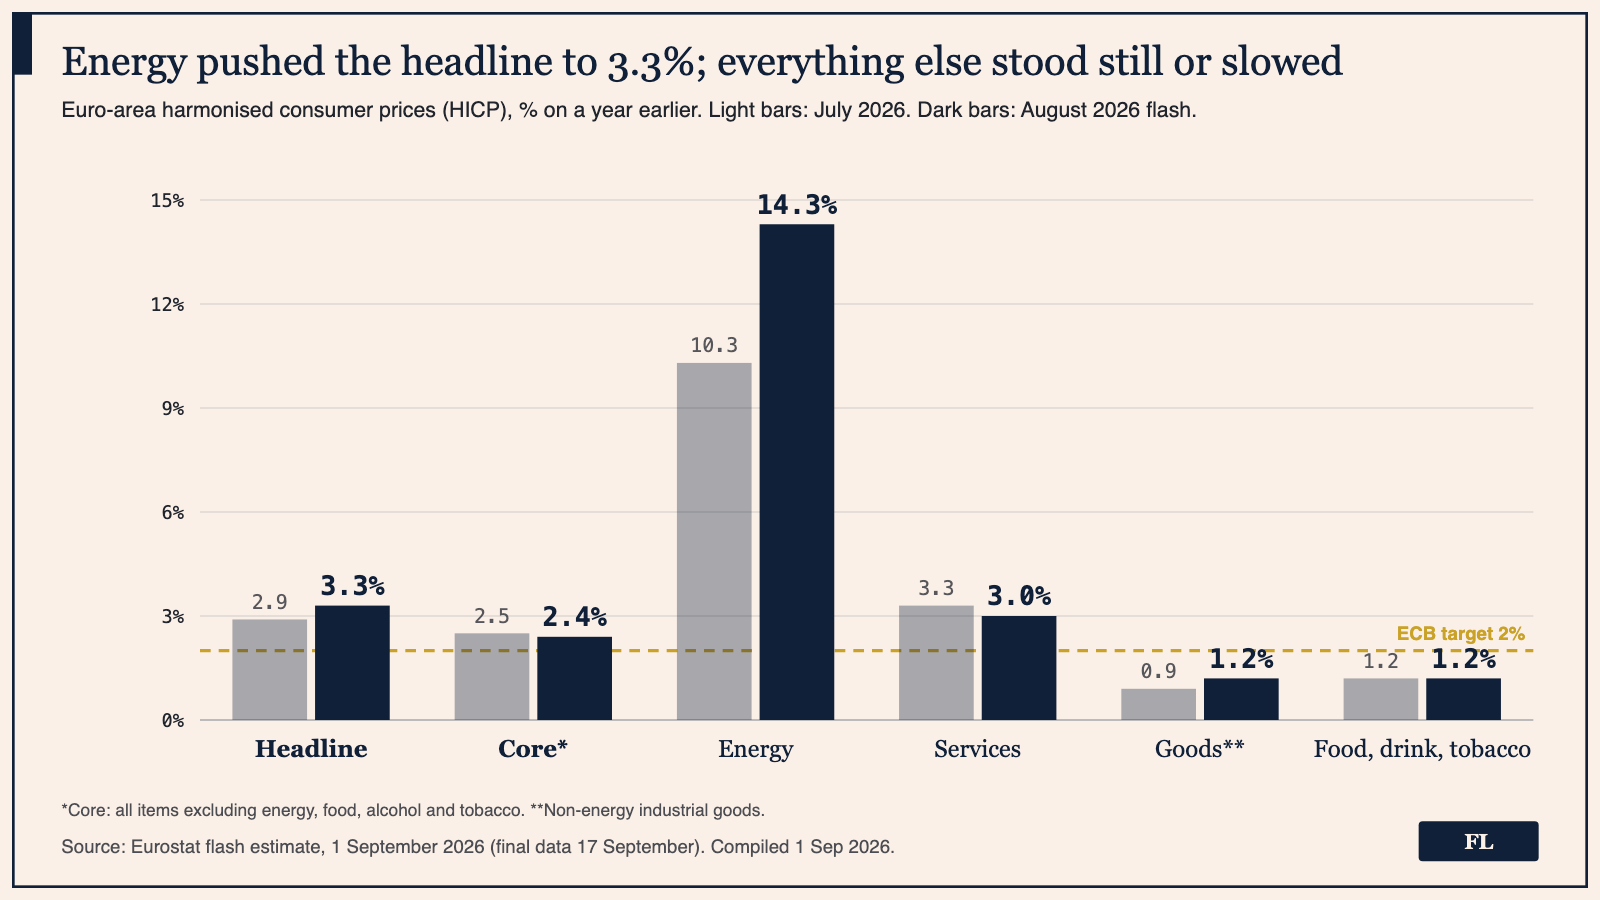
How to read this: compare each pair of bars, light for July, dark for August, and ask which pairs actually changed. Only energy jumped; services shortened, goods and food barely moved, and core, the total without those volatile lines, went down. When the headline and the core move in opposite directions, the headline is telling you about one price, not about prices in general. Energy is a small slice of the basket, which is why 14.3% on that line adds only a few tenths to the whole.
📅 Tomorrow
Tonight, 4 pm Frankfurt: the US ISM manufacturing index for August, after 52.6. Wednesday is quiet in Europe: Bundesbank president Buch speaks in the afternoon. Thursday, 10 am: final August PMIs; 11 am, July producer prices. Friday, 2:30 pm: the US jobs report. Thursday week, 10 September: the ECB in Berlin.
One question. Today's chart showed headline inflation rising to 3.3% from 2.9% while core slipped to 2.4% from 2.5%. Which reading is right? A: prices of most things sped up in August, and energy added a little on top. B: the rise was concentrated in energy; leaving out energy, food, alcohol and tobacco, price growth slowed a touch. C: core falling means overall inflation is falling too, and the 3.3% is a rounding effect.
Forwarded this by a friend? Subscribe here. Found it useful? Forward it to one person who'd want it.
We explain; we never advise. Nothing here is investment advice.
Financial Literature is for educational and informational purposes only. Nothing here is investment, financial, legal, or tax advice, or a recommendation to buy or sell any security. Content is impersonal and not tailored to any individual. Data may contain errors — verify before relying on it. Sources: Eurostat (August flash HICP, July unemployment); Destatis; Investing.com (STOXX 600, DAX, FTSE 100, CAC 40, Germany 10Y, Reuters via Investing.com); Google Finance (STOXX 600, DAX, FTSE 100, CAC 40, EUR/USD, GBP/USD); ECB reference rates via Frankfurter; Trading Economics (markets, Bund, Brent, calendar); Euronews; investingLive; Insurance Journal (Bloomberg, tankers); CNN; ECB (key rates, July account, meeting calendar); GOV.UK; LiteFinance (calendar); oil fair-value reading: FL indicator board (FRED DCOILWTICO, DTWEXBGS, T5YIE).
— The Editorial Team