🌍 German lorry mileage fell in August; adjusted for the holidays, it rose
German industrial figures run a month behind. The motorway toll index does not. Raw, August's mileage fell; adjusted, it rose. The gap is the lesson.


Compiled Wednesday, 9 September 2026, at about half past ten in the morning in Frankfurt (CEST, UTC+2), a 5-min read. Index rows are Tuesday's closes, final. The currency and bond rows are Wednesday snapshots, still trading, and say so.
Yesterday's answer: B — because a balance is exports minus imports, and in July both fell, exports by 0.8% and imports by 5.7%, so the gap between two shrinking numbers grew.
Germany measures its industry with a lag. Monday brought July's production, Tuesday brought July's trade, and this morning brought August's lorries. The Federal Statistical Office reported that mileage on German motorways by trucks with four or more axles rose 0.6% in August against July, once the calendar and the season are taken out, and was 2.0% higher than in August last year. Raw, the same index fell almost 12%. Today's lesson is what an adjusted number is for, and what it costs you to ignore one.
📊 The Dashboard, Tuesday, 8 September 2026 (closes)
| Gauge | Level | Move | What this means |
|---|---|---|---|
| STOXX 600 (pan-Europe) | 649.60 | 🔴 ▼ -0.05% | Final: Investing.com and MarketScreener, from 649.90 on Monday. It traded as low as 645.97 during the day and finished where it started. Wednesday morning about 646, half a percent lower, still trading. |
| DAX (Germany) | 26,007.63 | ⚫ unchanged | Final: Google Finance and Investing.com, one point above Monday. Wednesday morning 25,877.27, down 0.5%, still trading. |
| FTSE 100 (UK) | 10,811.66 | 🔴 ▼ -0.10% | Final: Google Finance and Investing.com. Wednesday morning 10,780.87, still trading. |
| FTSE MIB (Italy, rotation row) | 52,177.47 | 🔴 ▼ -0.10% | Milan's 40 largest listings, unusually heavy in banks, so it tends to move with euro-area rate expectations more than its neighbours do. Final: Google Finance and Investing.com. |
| EUR/USD | 1.1614 | 🔴 ▼ euro a touch softer | Tuesday's ECB reference rate, from 1.1622 on Monday. Wednesday, still trading: 1.1637. |
| GBP/USD | ≈1.3547 | 🟢 ▲ +0.04% | Wednesday snapshot, still trading: 1.3547, from 1.3541. |
| Bund 10Y yield | ≈3.37% | 🔴 ▲ +1 bp | Wednesday snapshot, still trading: 3.3720%, from 3.3574%. Red because a higher yield means a lower bond price. |
| Gilt 10Y yield (UK) | ≈5.19% | 🔴 ▲ +1 bp | Wednesday snapshot, still trading: 5.1908%, from 5.1778%, still below last Wednesday's 5.28%. |
What happened, in plain words
The Governing Council of the European Central Bank sat down in Berlin this morning for the first of two days, hosted by the Bundesbank. The decision itself comes on Thursday at 14:15 Berlin time, with the press conference half an hour later. The deposit rate is 2.25% now, and a Reuters poll of 65 economists found all of them expecting a quarter-point rise to 2.50%. When a number is that widely expected it stops being the news. The sentence about what comes after it is the news.
Oil is what makes the timing awkward. Brent crude touched 100.19 dollars a barrel on Wednesday morning before easing back near 99.7, up about 1.8% on the day, after fresh strikes on Saudi energy facilities and more disruption around the Strait of Hormuz. Trading Economics reports that this is the first time Brent has traded above 100 dollars since July. Energy is the line in euro-area inflation a central bank can do least about, and it has been doing most of the pushing since the spring.
Shares took all of this quietly. One share did not: Novartis closed 10.9% lower on Tuesday after an experimental treatment for a muscle-wasting disorder failed in a late-stage trial, a day after a cholesterol drug failed too, and the Swiss benchmark fell 1.6%. That is worth holding on to: an index is a weighted average, so a large enough member can move the whole board on news that has nothing to do with interest rates or oil.
⭐ Spotlight: the truck toll mileage index, up 2.0% on the year
Every lorry with four or more axles pays to use a German motorway, and every payment leaves a digital record of how far it went. The Federal Logistics and Mobility Office and the statistical office turn those records into a monthly index, and the office says plainly what it is for: the index "provides approximate indications of the development of industrial production in Germany at an early stage". That is why anyone watches it. Toll records exist the moment the lorry drives, so August's freight reading arrived this morning while the official production figure for Germany is still the July one we read on Monday. The price of that speed is that the index counts kilometres, not value: it cannot tell you what was in the trucks, and it sees nothing that leaves by ship, plane or pipeline.
📈 Chart of the Day: one month, two answers
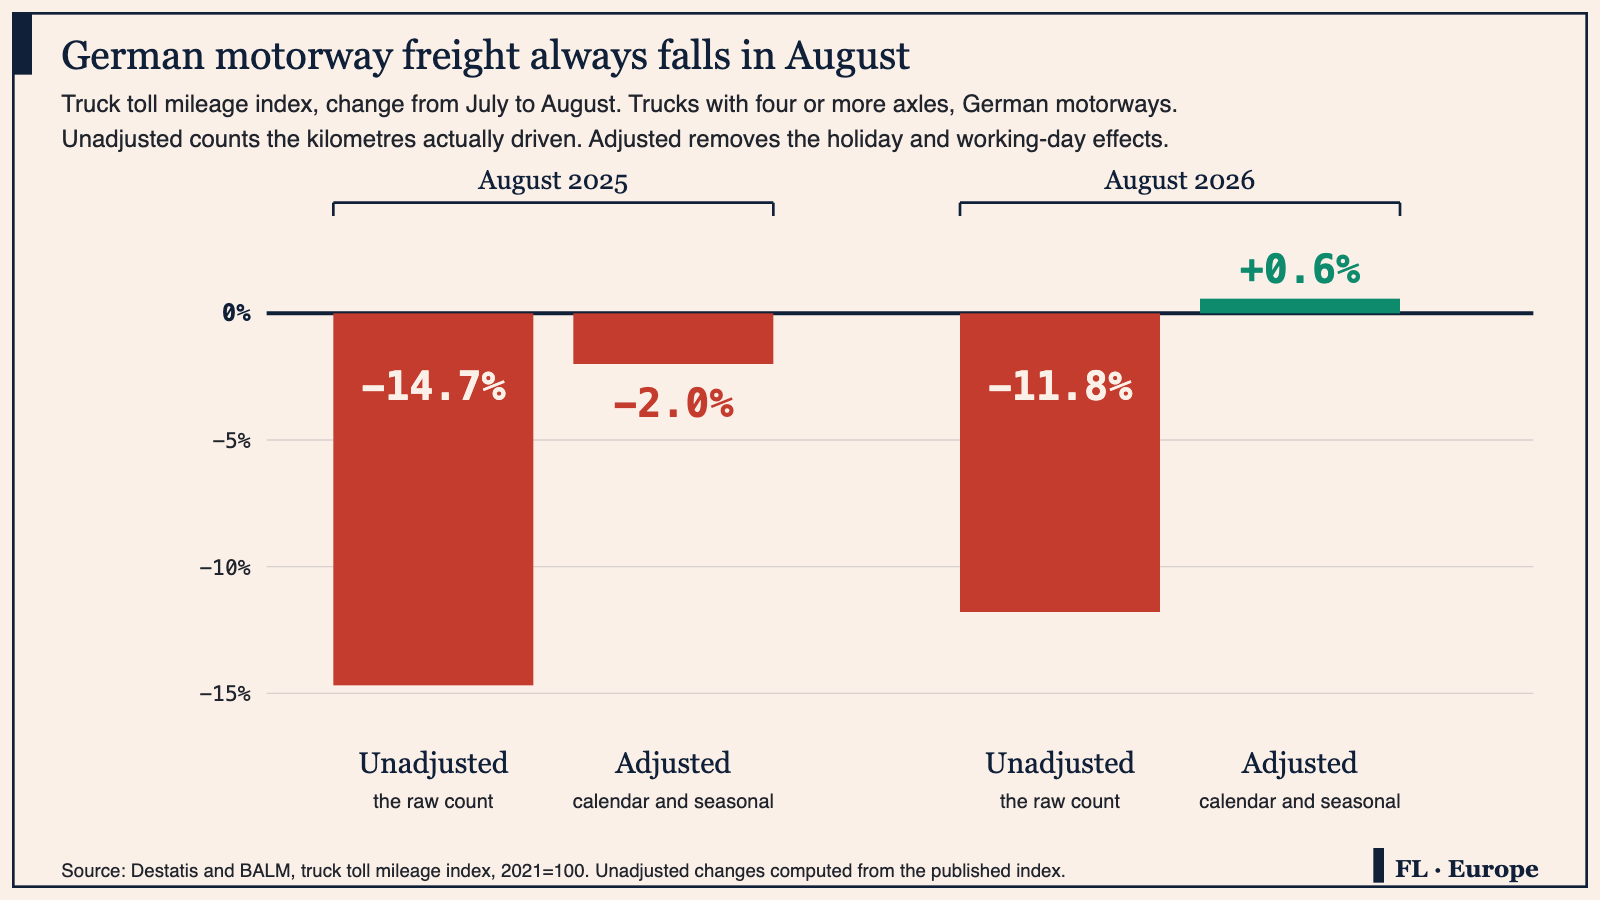
How to read this: a raw number and an adjusted number answer different questions, so they can point in opposite directions in the same month without either being wrong. Raw, the index counts the kilometres actually driven, and it fell from 100.5 in July to 88.6 in August because a good part of Germany is on holiday and there are fewer working days. It did the same thing last year, and the year before that. Adjustment strips out the pattern that repeats every year, so the question becomes whether this August was busier or quieter than a normal August, which is the only version you can honestly set beside July. When you meet a monthly figure, look for the words "seasonally adjusted" before you decide what it told you.
📅 Tomorrow
Two Berlin releases, in this order. At 08:00 the statistical office confirms German inflation for August, where the provisional reading was 2.9%; final figures rarely move far from the flash, and the interest is in which components were revised. At 14:15 the rate decision lands, and at 14:45 the president takes questions, which is where the guidance actually gets set. Both the decisions and the daily reference rates come from the bank's own publications, catalogued for readers as European Central Bank on the Data Catalog.
One question. Today's chart showed the German truck toll mileage index down 11.8% from July to August unadjusted, and up 0.6% over the same two months after calendar and seasonal adjustment. Which reading is right? A: The adjustment turned a fall into a rise, so the rise is an artefact and freight really fell. B: The unadjusted figure mostly records the August holidays, which happen every year, while the adjusted figure asks whether this August was busier or quieter than a normal one. C: The two figures cover different months, so they cannot be compared.
Financial Literature is for educational and informational purposes only. Nothing here is investment, financial, legal, or tax advice, or a recommendation to buy or sell any security. Content is impersonal and not tailored to any individual. Data may contain errors, verify before relying on it. We explain; we never advise. Sources: Destatis, Federal Logistics and Mobility Office, European Central Bank, Google Finance, Investing.com, MarketScreener, Trading Economics, Reuters via AOL, RTE.
Forwarded this by a friend? Subscribe here. Found it useful? Forward it to one person who'd want it.
— The Editorial Team