🌎 3.4%, 3.7%, 4.7% — one July, three inflation gauges, one Fed target
Wall Street reopens with oil near six-week highs. July inflation reads 3.4% on the CPI, 3.7% on the PCE index and 4.7% on the PPI.

Compiled Tuesday, 8 September 2026, about 7:15 a.m. in New York (Eastern Time), before the opening bell. A 4-min read. The American exchanges and the US bond market were shut on Monday for Labor Day, so the US index rows below are Friday's closes and the Mexican row is Monday's. Yields, currencies and oil trade around the clock, so those rows are Tuesday-morning snapshots.
Yesterday's answer: B — because the payroll headline is only the total of the industry lines beneath it, and a line's size means nothing until you set it against its own recent average. Health care still added jobs in August; it just added far fewer than in a normal month.
New York reopens this morning into a higher oil price, a new set of Canadian tariffs on American goods, and the last two inflation readings the Federal Reserve will see before it decides on 16 September. Three inflation gauges for July are already published. They read 3.4%, 3.7% and 4.7%, and only one of them is the number the Fed has promised to bring back to 2%.
📊 The Dashboard
| Gauge | Level | Move | What this means |
|---|---|---|---|
| S&P 500 (500 big US firms) | 7,718.60 | 🔴 ▼ −0.38% | Friday's close, and still the latest one. There was no Monday session to report. |
| Nasdaq Composite (tech-heavy) | 26,506.99 | 🔴 ▼ −0.29% | Friday's close. Futures pointed lower again this morning. |
| Dow (30 blue-chip firms) | 53,414.25 | 🔴 ▼ −0.51% | Friday's close. Dow futures were down about 400 points before the bell. |
| S&P/BMV IPC (Mexico, rotation row) | 64,727.54 | 🔴 ▼ −0.21% | Monday's close. Mexico was the one large exchange in the Americas that traded, on thin volume; Televisa fell 12.7% after S&P Dow Jones flagged its removal from the index in a preliminary rebalancing. |
| US 10-year Treasury yield | 4.79% | ⚪ ▲ +1 bp | Tuesday-morning snapshot, from Friday's 4.78% close. Monday has no row on that table at all, because the market was shut. |
| Dollar index (DXY) | 99.01 | ⚪ ▲ dollar firmer | Tuesday-morning snapshot, up about 0.1% on the day. |
| USD/CAD | 1.3809 | ⚪ ▼ loonie steady | Tuesday-morning snapshot, barely moved on the morning Canada's counter-tariffs take effect. |
| USD/MXN | 16.97 | ⚪ ▲ peso weaker | Tuesday-morning snapshot, about 0.4% softer against the dollar. |
| Brent crude | $98.56 | ⚪ ▲ +1.6% | Still trading. A third day higher, and the highest since late July. |
What happened, in plain words
Three things happened while New York was closed. American and Iranian forces struck each other's shipping in and around the Strait of Hormuz over the weekend, and oil rose for a third day, with Brent reaching about $97.90 on Monday and trading near $98.50 this morning. Canada's counter-tariffs on American steel, electronics, appliances and farm equipment take effect today, matching Washington's 50% duties on about $20bn of Canadian goods. And American stock futures sat lower before the bell.
None of that changes what the Federal Reserve said it is watching. Two price reports land this week: producer prices on Thursday and consumer prices on Friday, both at 8:30 a.m. Eastern on the official schedule. They are the last inflation figures the committee sees before it meets on 15 and 16 September. Interest-rate futures this morning put the chance of a quarter-point rise at 58.7%, against 41.3% for no change, on one monitor at 6:55 a.m. Eastern.
⭐ Spotlight: the Producer Price Index, 4.7%
Thursday's report is the one most readers skip, and this week it comes first. The Producer Price Index measures what American producers are paid for their output, before it ever reaches a shop; the "final demand" headline covers what they sell for personal consumption, investment, government and export. In the year to July it rose 4.7%, with goods up 6.5%, services up 3.9%, and producer energy prices up 18.2%. It is worth an hour of your attention on Thursday for one reason: the Bureau of Economic Analysis builds most of the Fed's own price index by extrapolating BLS consumer and producer indexes, so parts of Thursday's report reappear inside the gauge the Fed actually targets.
📈 Chart of the Day
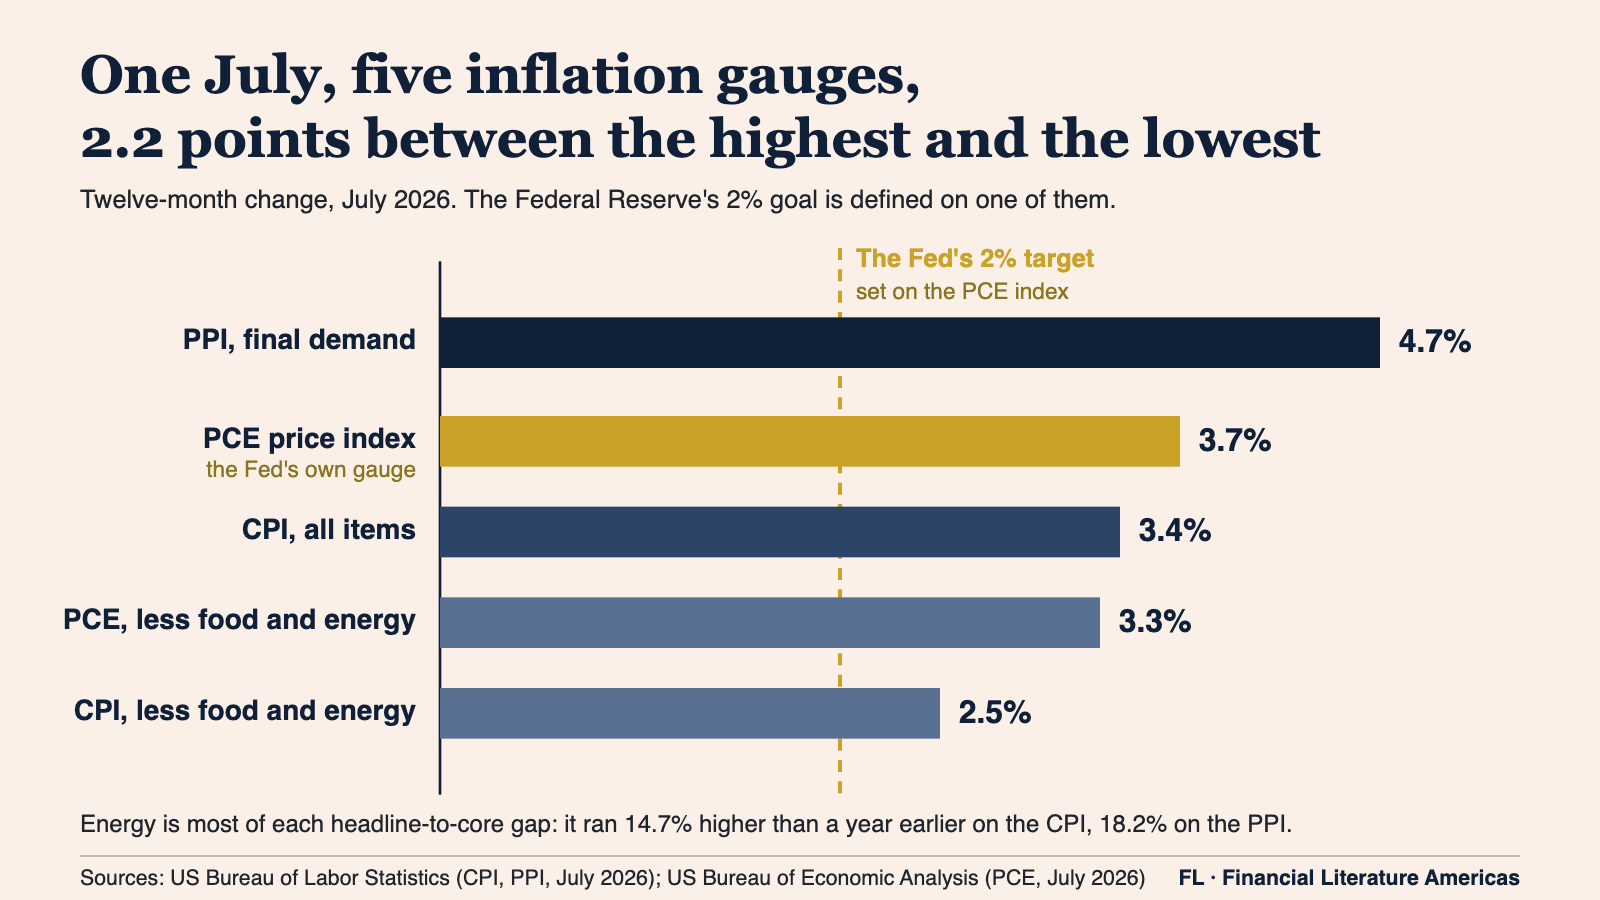
How to read this. The first move is to ask what each gauge measures before comparing it to anything. The CPI prices a fixed basket bought by urban households. The PCE index prices everything consumed on households' behalf, including the health care their employers and governments pay for, and lets the basket shift as people substitute. The PPI prices what producers receive. Five different questions produce five different answers, so a gap between them is the normal state of the world, not an error in one of them. The second move is to find the gauge attached to the decision in front of you. The Fed's 2% goal is written on the PCE index, so Friday's consumer number is evidence about that target rather than the target itself. And most of the distance between each headline gauge and its core version is energy: it ran 14.7% above a year earlier on the CPI and 18.2% on the PPI, which is why a rising oil price pushes the headline gauges apart from the core ones.
📅 Tomorrow
The Treasury reopens the 10-year note at 1 p.m. Eastern on Wednesday, per its tentative auction schedule, on the same day its enlarged buybacks of long-dated debt begin. An auction is the plainest live reading of what buyers demand to lend to the government for ten years: compare the yield the sale clears at with the 4.79% the note trades at this morning.
One question. Today's chart showed five US inflation gauges for the same month, July 2026, spread from 2.5% to 4.7%. Which reading is right? A: four of the five are wrong and one is correct. B: they price different baskets for different buyers, so they answer different questions, and the Fed's 2% goal is written on only one of them, the PCE index. C: the highest of the five is the number the Fed has to bring down to 2%.
Forwarded this by a friend? Subscribe here. Found it useful? Forward it to one person who'd want it.
We explain; we never advise. Nothing here is investment advice.
Financial Literature is for educational and informational purposes only. Nothing here is investment, financial, legal, or tax advice, or a recommendation to buy or sell any security. Content is impersonal and not tailored to any individual. Data may contain errors, so verify before relying on it. Sources: BLS Consumer Price Index; BLS Producer Price Index; BEA Personal Income and Outlays; Trading Economics; US Treasury; Investing.com; Reuters via Business Recorder; El CEO; Al Jazeera.
— The Editorial Team