🌎 S&P 500 −0.3% — a red Monday closed a green August
US–Iran strikes lifted oil; the S&P 500 fell 0.3% and the 10-year yield closed at its highest since January 2025, yet every board finished August higher.

Compiled Tuesday, 1 September 2026, about 7:15 a.m. in New York (Eastern Time), before the opening bell. A 4-min read. Stock index rows are final Monday closes; bond yields, currencies and oil trade around the clock, so those rows are Tuesday-morning snapshots and labeled as such.
Yesterday's answer: B — because a futures-implied probability is a price, not a decision: 57% said the market leaned toward a hike while nearly half the money still priced a hold, and every data print before 16 September moves it again. It moved again on Monday, to about 62%.
US and Iranian forces exchanged fire for the first time in a month, oil rose, the 10-year Treasury yield closed at its highest since January 2025, and the S&P 500 fell 0.3%; and yet, measured on the month, every board finished August higher. Today’s issue is about those two rulers.
📊 The Dashboard, Monday, 31 August 2026 (closes)
| Gauge | Level | Move | What this means |
|---|---|---|---|
| S&P 500 (500 big US firms) | 7,686.14 | 🔴 ▼ −0.33% | Final. Down 25.62 points (Investing.com prints the same close). Still +12.3% for the year and, from the 31 July close of 7,489.72, +2.6% for August. |
| Nasdaq Composite (tech-heavy) | 26,370.89 | ⚪ ▼ −0.12% | Final. Down 31.53 points (Investing.com agrees); the day’s steadiest board and +13.5% for the year. |
| Dow (30 blue-chip firms) | 53,185.90 | 🔴 ▼ −0.70% | Final. Down 374.09 points (Investing.com agrees), the day’s weakest big board; +10.7% for the year. |
| Russell 2000 (2,000 smaller firms) | 2,956.45 | 🔴 ▼ −0.54% | Rotation row. Down 15.92 points (Investing.com agrees); still the year’s leader at +19.1%. |
| US 10-year Treasury yield | ≈4.79% | 🔴 ▲ 20-month high | Tuesday snapshot. Monday it rose about 3 basis points to 4.756%, its highest close since January 2025; this morning 4.79%, with the 2-year at 4.36% and the 30-year at 5.28% (Investing.com reads the same). Higher yield, dearer mortgages. |
| Dollar index (DXY) | ≈99.6 | 🟢 ▲ +0.2% | Tuesday snapshot, about 99.6 from 99.4 at Monday’s close. |
| USD/CAD | ≈1.387 | 🔴 ▲ loonie weaker | Tuesday snapshot, about 1.387 from 1.385. The Bank of Canada decides Wednesday at 9:45 a.m. ET, press release only, no press conference. A rising pair means a weaker Canadian dollar. |
| USD/MXN | ≈17.00 | 🔴 ▲ peso weaker | Tuesday snapshot, about 17.00 from 16.98. Mexico’s 6.50% rate still beats the Fed’s 3.50–3.75%; a US hike would narrow that gap. |
What happened, in plain words
On Sunday US forces struck Iranian rocket launchers on Larak Island, at the mouth of the Strait of Hormuz, and Iran fired back at US-linked targets in Jordan and the UAE. Oil did the first move: WTI settled at $85.76, up 2.8%, Brent at $90.56, up 2.7%, and Brent is above $92 this morning, up about 10% over a month. Dearer oil means higher inflation, and higher inflation means a Fed chair who put prices first on Friday is more likely to raise rates: futures priced the September hike at about 62% by Monday’s close, from roughly 40% a week earlier, and the 10-year yield closed at its highest since January 2025. That is why stocks slipped: nine of eleven S&P sectors fell, energy led, and Amazon closed down 2.5% at $259.77 after the FTC sued it over the way it prices advertising.
Step back a month and the picture flips. From the 31 July closes to Monday’s, the S&P 500 rose 2.6%, the Nasdaq 3.9%, the Dow 1.3% and the Russell 2000 0.9%. For the S&P 500 and the Nasdaq it was the first up month since May; for the Dow, a fifth straight monthly gain; both the S&P 500 and the Dow set record highs during August. The same market was red on Monday and green for August, and both facts are true.
⭐ Spotlight: the monthly return, +2.6%
A monthly return is the change from the last close of one month to the last close of the next: for the S&P 500, from 7,489.72 on 31 July to 7,686.14 on 31 August, which is +2.62%. Fund reports, pension statements and the “first up month since May” lines in the press all use this ruler, because a calendar month compresses about 21 sessions of noise into one number that says which way the market travelled. Watchers read it next to the daily move for the reason Monday showed: the day tells you the mood, the month tells you the direction, and confusing the two is the commonest beginner’s error on a red day.
📈 Chart of the Day, two rulers on one board
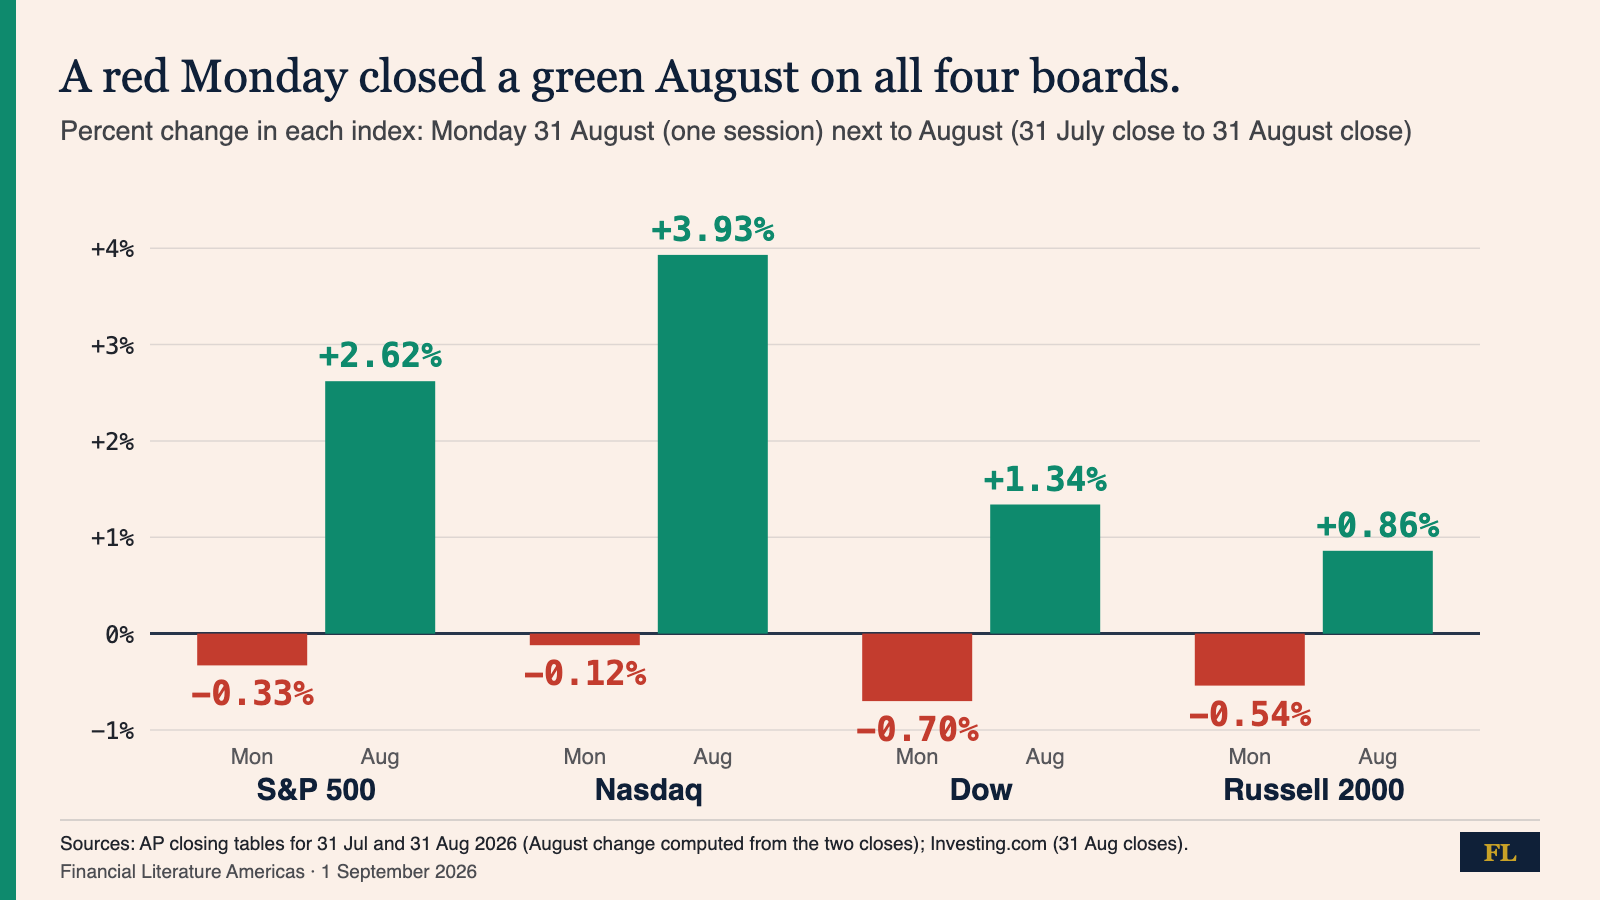
How to read this: read the label under each bar before its colour; “Mon” is one session, “Aug” is 21 of them, and the August bar already contains Monday’s fall. Then compare sizes, not signs: the S&P 500 was up about 3% for the month before Monday and gave back a third of a point, so the month kept roughly nine-tenths of its gain. Streaks and “first month since” lines live on the monthly ruler; record highs and bad days live on the daily one; never add the two together.
📅 Tomorrow
Today at 10 a.m. ET: ISM manufacturing for August, after July’s 55.6, the strongest since May 2022, with forecasts collected by Investing.com and Trading Economics at 55.0 to 55.2, and the prices-paid line near 71; also July job openings (about 7.33 million expected, from 7.36 million) and construction spending. Wednesday: ADP payrolls at 8:15, factory orders at 10, the Fed’s Beige Book at 2 p.m. ET, and the Bank of Canada at 9:45 a.m. ET. Thursday ISM services; Friday, 4 September, the August jobs report at 8:30 a.m. ET. US markets close Monday, 7 September, for Labor Day; the Fed decides on 16 September. Tomorrow’s issue decodes the ISM 50-line.
One question. Today’s chart showed the S&P 500 down 0.33% on Monday and up 2.62% for August. Which reading is right? A: The index lost ground in August, because it fell on the month’s last day. B: Both are true at once: they measure different spans, one session and one calendar month, and the August figure already includes Monday’s fall. C: The August figure stops at Friday, so Monday’s fall is not counted yet.
We explain; we never advise. Nothing here is investment advice.
Financial Literature is for educational and informational purposes only. Nothing here is investment, financial, legal, or tax advice, or a recommendation to buy or sell any security. Content is impersonal and not tailored to any individual. Data may contain errors — verify before relying on it. Sources: AP (Monday closes, via WTOP); AP (31 July closes, via Barchart); S&P 500; Nasdaq; Dow; Russell 2000; Yahoo Finance live blog (yields, hike odds, movers); Investrade market review (sectors, oil, 10-year); Motley Fool via Yahoo Finance (monthly streaks); FXEmpire (10-year, energy stocks); 10-year, 2-year, 30-year; 10-year (Investing.com); DXY (Trading Economics); DXY (Investing.com); USD/CAD; USD/MXN; Brent, Iran; Investing.com (Amazon, FTC); ISM manufacturing; Investing.com (Tuesday releases); Scotiabank Economics release calendar; Bank of Canada; Federal Reserve (Chair Warsh, 28 Aug); FOMC calendar; NYSE calendar.
Yesterday’s issue, the Fed chair put prices first, and Thursday’s, the inflation print that ran a tenth hot, are the habit this one builds on.
Forwarded this by a friend? Subscribe here. Found it useful? Forward it to one person who’d want it.
— The Editorial Team