What is a PMI, and what does a reading of 50 actually mean?
Purchasing managers answer better, same or worse. How that becomes one number, why 50 is the line, and why the headline can hide a part below it.

The short answer: a PMI, or purchasing managers' index, is a monthly survey that asks the people who buy supplies for companies whether business is better, the same or worse than last month, and turns their answers into one number. Fifty is the no-change mark: above it, more firms reported improvement than deterioration, and that is a statement about how many firms, not about how much output rose.
What a PMI is
The survey is deliberately simple. Purchasing managers are asked about a short list of things they see every day, new orders, production, hiring, deliveries from suppliers, stocks, and for each one they pick better, the same, or worse. There is no number to estimate and nothing to look up, which is why the answers come back fast enough to publish in the first days of the following month, weeks before official statistics.
The answers become an index through one line of arithmetic, set out in the PMI compilers' own introduction: "INDEX VALUE = (% 'up') + (0.5 * (% 'the same')) + (0.0 * (% reporting 'down'))". Everyone who says better counts once, everyone who says the same counts half, and everyone who says worse counts nothing. The result sits between 0 and 100 with, in the document's words, "a theoretical no-change mark at 50". That construction has a name worth keeping: a diffusion index. It measures how widely a change has spread, not how big it is.
Who tracks it, and why
In the United States the best-watched version is published by the Institute for Supply Management, which runs two panels, one for factories and one for services. ISM states the reading rule in its own release: "An index reading above 50 percent indicates that the services economy is generally expanding; below 50 percent indicates that it is generally declining."
The headline everyone quotes is not itself a question anyone was asked. It is an average of the sub-indexes: the Services PMI is "a composite index based on the diffusion indexes for four of the indicators with equal weights: Business Activity, New Orders, Employment and Supplier Deliveries", and the factory version is the same idea over five: New Orders, Production, Employment, Supplier Deliveries and Inventories. You can check the arithmetic yourself. August's services parts were 61.7, 60.9, 51.3 and 47.8; add them, divide by four, and you get 55.425, which rounds to the 55.4 that led the wires.
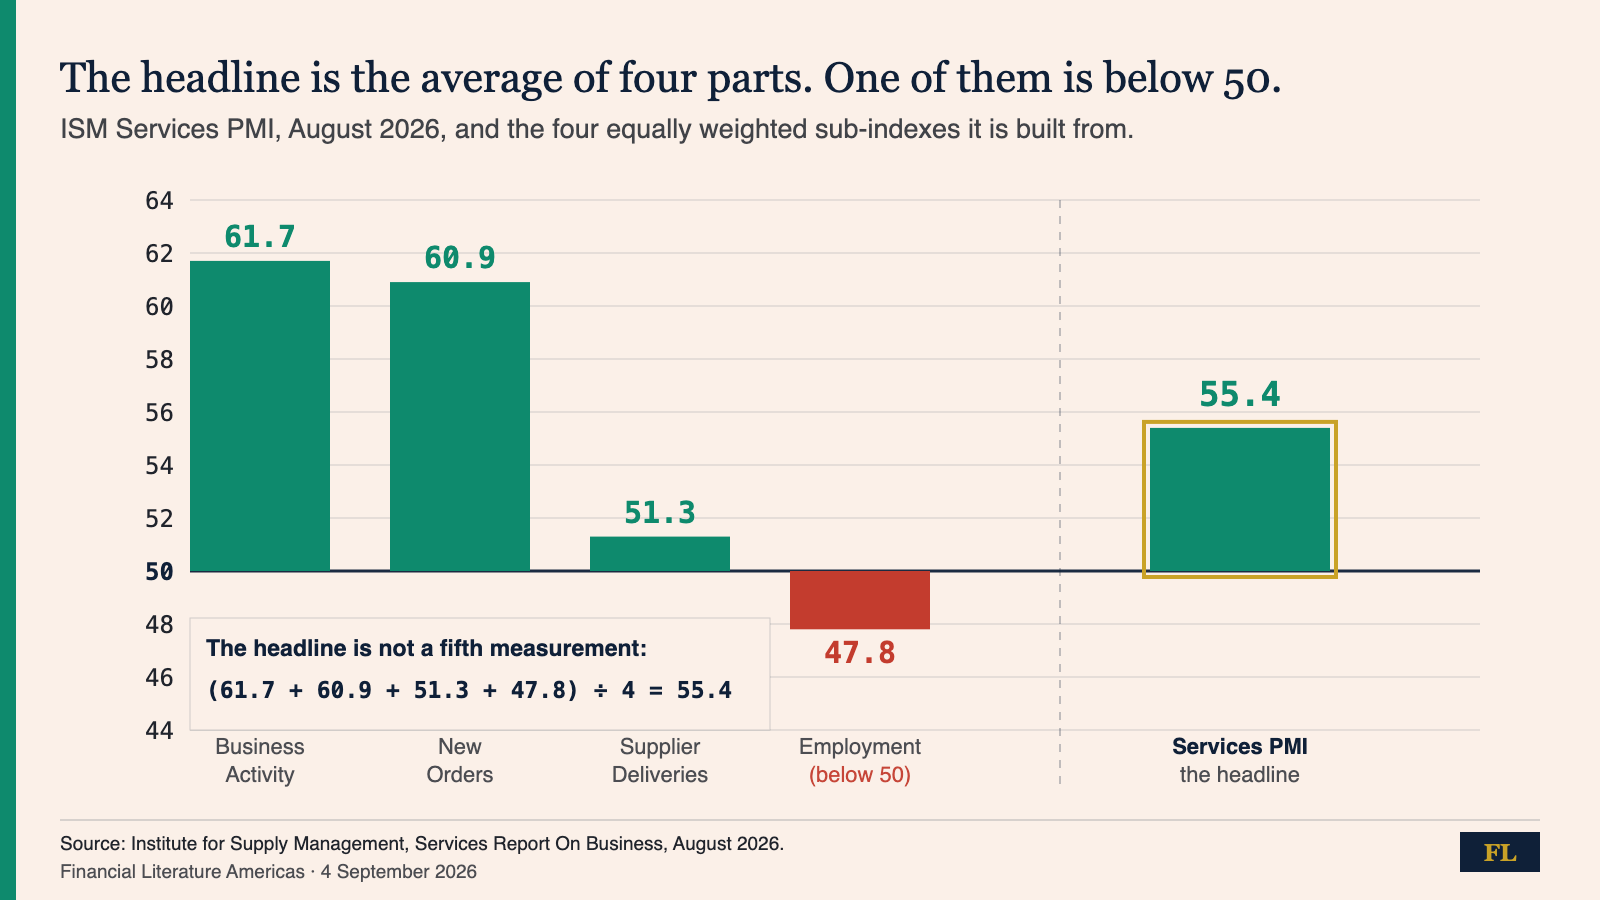
How to read this: read the parts before the headline. Three bars sit above the 50 line and one, employment at 47.8, sits below it, which means service firms were reporting more work and fewer people in the same month. Then ask which part did the lifting, because a rise driven by new orders is demand arriving, while a rise driven by supplier deliveries is deliveries getting slower, scored as a positive by the index and as a nuisance by anyone waiting for a shipment.
How to read a move, in three steps
First, compare the number with 50, not with zero. A fall from July's 55.6 to August's 54.6 in the factory survey is still a majority of firms reporting growth, just a smaller majority. The move that changes the story is a reading crossing the line.
Second, open the parts. A headline can hold a sub-index pointing the other way, and August's services reading did.
Third, remember that 50 is the line for the surveyed sector, not for the country. ISM publishes a different threshold for the whole economy: above 47.5 for the factory index and above 48.1 for services, sustained over time, corresponds to an expanding economy. A manufacturing PMI of 49 is a shrinking factory sector inside a growing economy, which is exactly the kind of sentence a reader who only knows the 50 line will get wrong.
What a PMI is not
It is not a measure of output. A small increase and a record quarter both count as one "better", so the index cannot tell you the size of anything. It is not a government statistic, and it is not revised the way official data is, though its seasonal factors are updated. It is not a forecast. And it is not the only PMI: several companies survey the same economy with different panels, so two PMIs for one country can disagree in a month without either being wrong.
The habit
Find the line, then the parts, then the direction. We used it on Tuesday, when the factory gauge slipped to 54.6, and again on Friday, when a strong services headline carried a shrinking employment index inside it. The archive keeps the daily series.
Financial Literature is for educational and informational purposes only. Nothing here is investment, financial, legal, or tax advice, or a recommendation to buy or sell any security. Content is impersonal and not tailored to any individual. Data may contain errors, so verify before relying on it. We explain; we never advise. Sources: Institute for Supply Management Report On Business (August 2026, manufacturing and services), IHS Markit introduction to the PMI.
Forwarded this by a friend? Subscribe here. Found it useful? Forward it to one person who'd want it.
— The Editorial Team