Why does France have two inflation rates? CPI and HICP, explained
France prints 2.4% and 2.7% on the same morning. What the harmonised index is, why it differs from the national CPI, and which one the ECB reads.

The short answer: France, like every euro-area country, publishes two inflation rates each month: its own consumer price index (CPI), built on national definitions and used at home, and the Harmonised Index of Consumer Prices (HICP), built to one shared method so that countries can be compared. Neither is wrong; the European Central Bank reads the harmonised one, and the French state indexes pensions and rents to the national one.
What the HICP is
The Harmonised Index of Consumer Prices is compiled by Eurostat, the EU's statistical office, together with the national statistical institutes. It was created in the 1990s so that a single currency could have a single inflation gauge: one basket definition, one set of rules, applied in Paris, Madrid and Berlin alike. It is the measure the ECB's mandate is judged on. The bank aims for 2% inflation over the medium term, measured by the HICP for the euro area as a whole, and it treats overshoots and undershoots as equally unwelcome.
The national CPI is older and does a different job. In France, INSEE's CPI is the legal reference for indexing pensions, the minimum wage and rents. Other countries use theirs the same way. That is why neither index can simply replace the other: one is written into national contracts, the other into the euro's monetary policy.
Why the two numbers differ
The gaps come from what each basket includes and how it prices things, not from different data on the same goods. Three differences do most of the work:
- Owning your home. From the outset, the HICP has left out the cost of living in a home you own; it covers rents but not the "imputed rent" owners are treated as paying themselves. Some national CPIs include it. The Czech National Bank has shown how large that can be: imputed rent alone opened a 0.7-point gap between its two rates in one month.
- Who pays. The HICP counts only what households pay out of their own pocket. For French health care, the HICP uses prices net of social-security reimbursement, where the CPI uses the gross price. A drug whose sticker price rises but whose reimbursement rises too looks different in the two indices.
- Weights. Because the baskets differ, the share of each category differs. Leave out housing and everything else, food and energy included, gets a larger weight, which is why the HICP often moves more on an oil month than the CPI does.
How to read a move
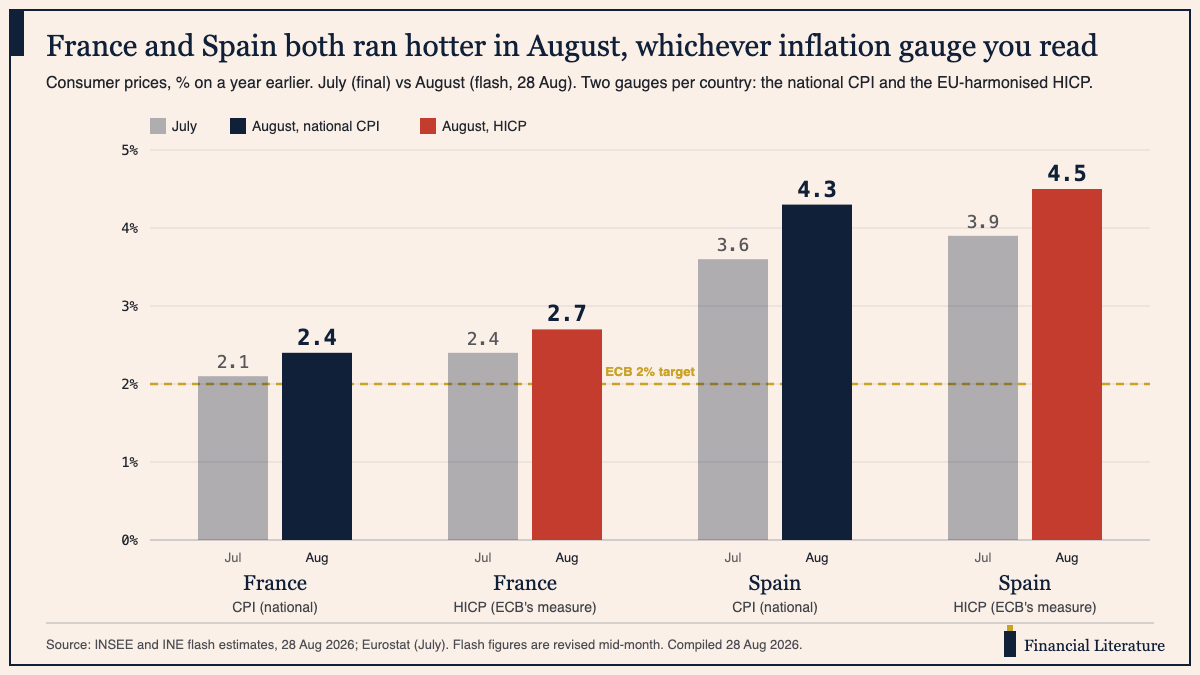
How to read this: the question a flash estimate answers is "up or down from last month, and by how much", so July-to-August is the move, and the gold line is the distance from target. Then compare the two gauges for one country: they move together (both French pairs rose 0.3 points) but sit at different heights, because they weigh different baskets. Finally, remember these are flash estimates: INSEE finalises August on 15 September, and revisions of a tenth are routine.
The August figures make the habit concrete. France's CPI rose to 2.4% from 2.1%, its HICP to 2.7% from 2.4%, on energy prices up 16.7% from a year earlier. Spain's CPI rose to 4.3% from 3.6% and its HICP to 4.5% from 3.9%. Three checks, in order:
- Which gauge is the headline quoting? "French inflation 2.7%" and "French inflation 2.4%" can both be correct on the same morning. Before comparing two countries, or a country with the ECB's target, make sure you hold the harmonised number.
- Did both gauges move the same way? Usually yes, as in August. When they split, the cause is almost always housing or an administered price, and that is the story.
- Is it a flash? National flashes land at month-end with partial data; Eurostat's euro-area flash follows within days, and finals arrive mid-month. A tenth can move between the two.
What the HICP is not
It is not the ECB's inflation rate for France. The bank sets one policy for the whole euro area and judges it against the euro-area HICP, so a French 2.7% or a Spanish 4.5% enters that judgement only in proportion to each country's weight. It is not a cost-of-living index either; by design it leaves out the largest cost most owners face, which is the reason the ECB asked the statistical system, after its 2021 strategy review, to work on bringing owner-occupied housing in. And it is not a forecast. It tells you what prices did over the past twelve months, nothing about the next twelve.
Earlier this week we read a survey against its forecast and an oil price into a bond yield; Friday's two prints were the same oil reaching the shop shelf, measured twice. The archive keeps the series.
Financial Literature is for educational and informational purposes only. Nothing here is investment, financial, legal, or tax advice, or a recommendation to buy or sell any security. Content is impersonal and not tailored to any individual. Data may contain errors — verify before relying on it. We explain; we never advise. Sources: INSEE, INE, Eurostat, European Central Bank, Czech National Bank.
Forwarded this by a friend? Subscribe here. Found it useful? Forward it to one person who'd want it.
— The Editorial Team