What is the equal-weight S&P 500, and why does it tell a different story from the index?
Same 500 companies, 0.2% each. How the equal-weight S&P 500 shows whether a rally belonged to the market or to a few giants.

The short answer: the equal-weight S&P 500 holds the same 500 companies as the ordinary S&P 500 but gives each one a 0.2% share, regardless of size. Watchers use it as "the average stock": when it and the ordinary index point in different directions, the day's move belongs to a handful of giants rather than to the market.
What the equal-weight S&P 500 is
The S&P 500 you see in headlines is weighted by market value. A company worth ten times another counts ten times as much, so the largest members carry most of the index's daily move. The equal-weight version, launched by S&P Dow Jones Indices on 8 January 2003, takes the identical list and resets every member to one five-hundredth. Prices drift the weights apart between resets, so the index is rebalanced back to equal weights every quarter.
Nobody trades an index directly, which is why most people watch it through the Invesco fund that tracks it, ticker RSP. When a market note says "equal-weight was down 0.3%", it is usually quoting that fund's close.
Who tracks it, and why
The question it answers is breadth: how many stocks took part in a move. A cap-weighted index can rise while most of its members fall, provided the members that rose were large enough. The equal-weight index cannot; with every company at 0.2%, it only rises when more value went up than down across the list. Reading the two side by side is the quickest test of whether a headline like "stocks rallied" describes the market or a few names in it.
The test has grown more useful as the top of the index has grown heavier. Invesco's own note put the ten largest companies at 34.5% of the S&P 500 as of August 2024, a share it compared with about 35% at the peak of the dot-com era. When a third of an index is ten names, the index and the average stock will disagree often.
How to read a move
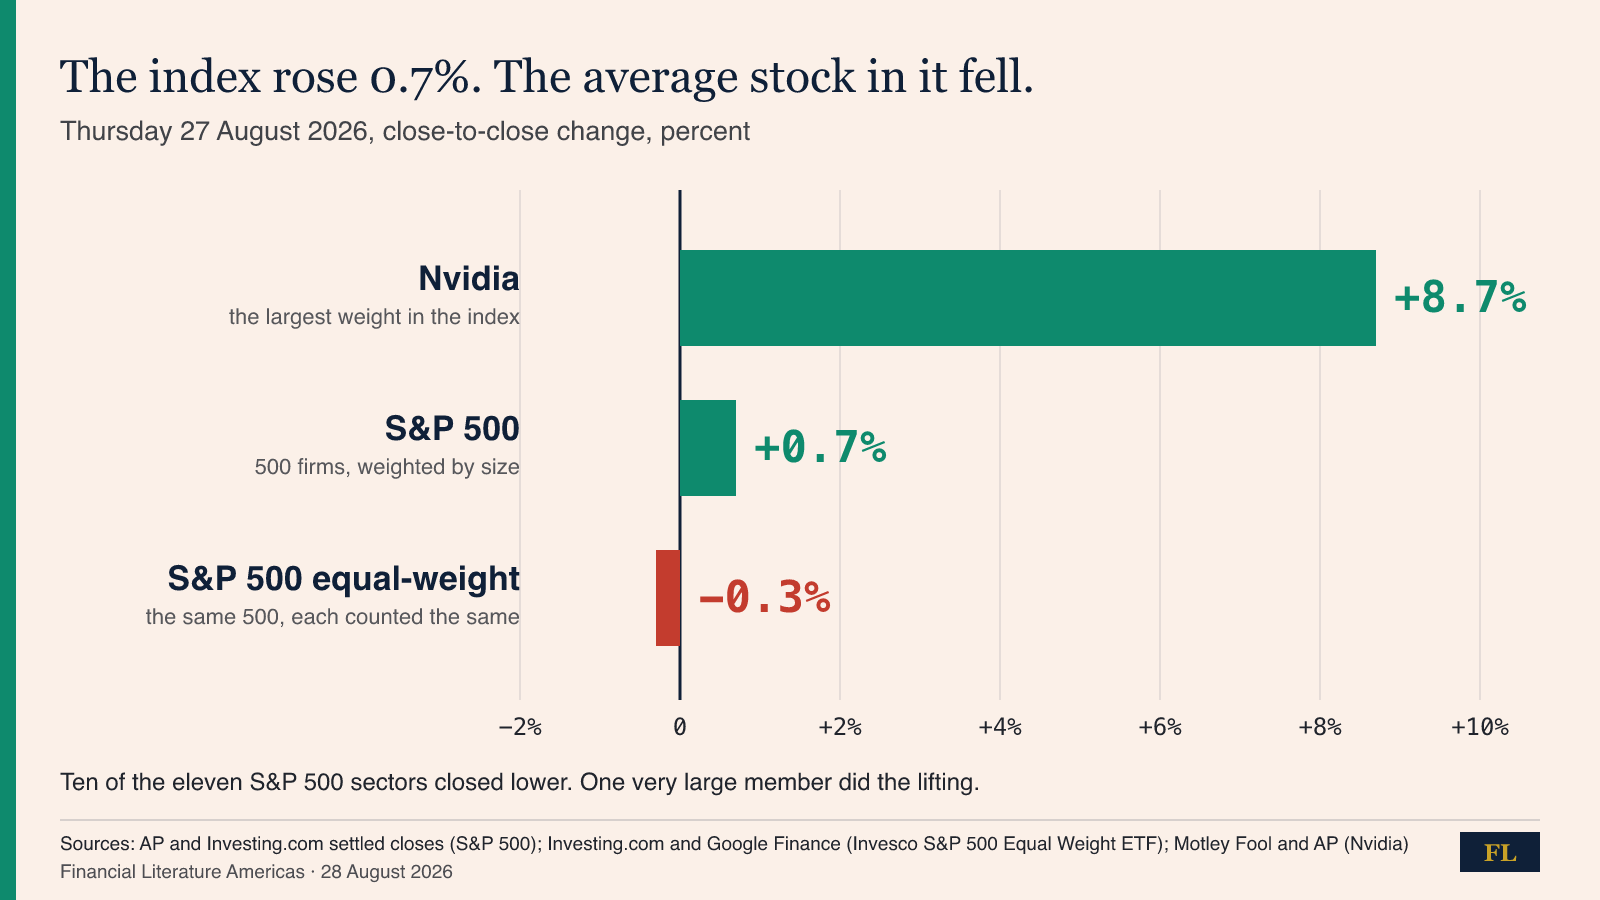
How to read this: read the gap between the two S&P 500 bars before you read either one. The top bar explains the gap: a company that is the largest weight in the index moved almost nine points, so the index could rise while most of its members did not. When a headline index moves on one stock's news, find the equal-weight figure; if the two bars point different ways, the day's story belongs to one company, not to "the market."
Thursday 27 August was a textbook case, and Friday's issue walked through it. Nvidia rose 8.7% after its results. The S&P 500 closed up 0.72%. The equal-weight fund closed down 0.30%, and ten of the eleven sectors finished lower. Three readings follow from that one gap:
- Same direction, similar size: a broad day. Most stocks moved with the index, and the headline describes the market.
- Same direction, very different size: a tilted day. Everyone moved, but the giants moved more (or less). Look at which sector led.
- Opposite directions, as on Thursday: a concentrated day. The index's move belongs to a few large members, and the "average stock" had a different day entirely. Both numbers are true; they answer different questions.
The scale to keep in mind: a gap of a full point in one session, +0.7% against −0.3%, is unusual and worth noticing. A gap of a tenth is noise. Over months the two indices can drift apart by many points, which tells you something about the era, not about any single day.
What it is not
It is not a "truer" S&P 500. Equal weighting is a choice with its own tilts: it gives the hundreds of smaller members of the list far more say than their size, so it behaves partly like a mid-cap index and moves with cyclical sectors more than the cap-weighted board does. It is a second lens, not a corrected one.
It is not a forecast. A concentrated day tells you who did the lifting; it does not tell you whether the giants will keep lifting or whether the rest will catch up. Both have happened, for long stretches. And it is not the index in your pension. Most index funds track the cap-weighted S&P 500, so when the two disagree, the cap-weighted number is the one that reached most portfolios.
This is the same reading skill we practised on Tuesday with baskets of different widths, one stock, thirty chips, the whole Nasdaq, the broad boards, and on Wednesday with a survey whose composite hid two large moves. An average is a summary; the parts hold the direction. The equal-weight S&P 500 is the quickest way to see the parts. The archive keeps the daily series.
Financial Literature is for educational and informational purposes only. Nothing here is investment, financial, legal, or tax advice, or a recommendation to buy or sell any security. Content is impersonal and not tailored to any individual. Data may contain errors — verify before relying on it. We explain; we never advise. Sources: Investing.com, Google Finance, Invesco, S&P Dow Jones Indices, AP via The Epoch Times, Neil Sethi's Markets Update.
Forwarded this by a friend? Subscribe here. Found it useful? Forward it to one person who'd want it.
— The Editorial Team